
Fig 3. Expression analysis of genes related to K+ transport by qRT-PCR.
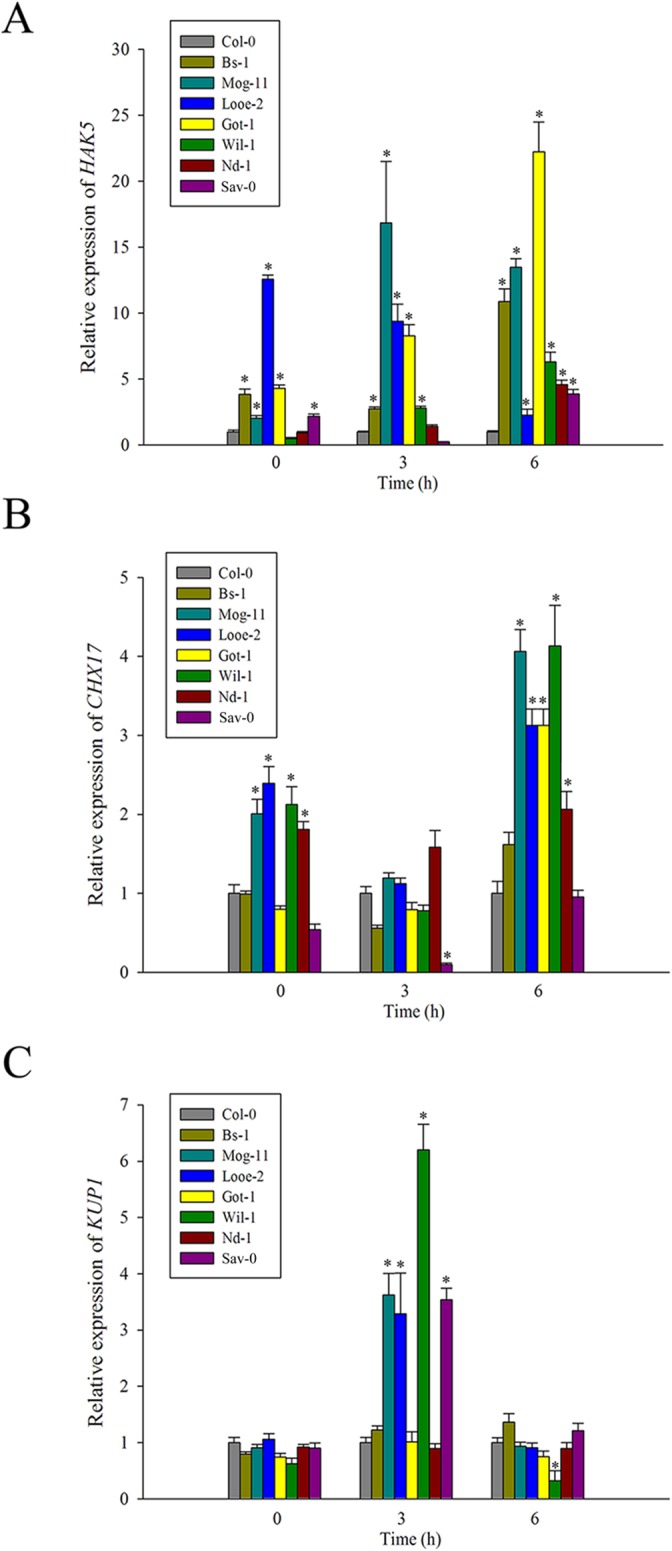
The transcript levels of (A) HAK5, (B) CHX17 and (C) KUP1 in Col-0 and the selected accessions exposed to 100 mM NaCl for 0, 3 and 6 h. Values given as mean ± SE (n = 3). Significant differences from Col-0 accession at the same time point are indicated by * or ** (P < 0.05, P < 0.01).