
Fig 5. The contents of compatible solutes.
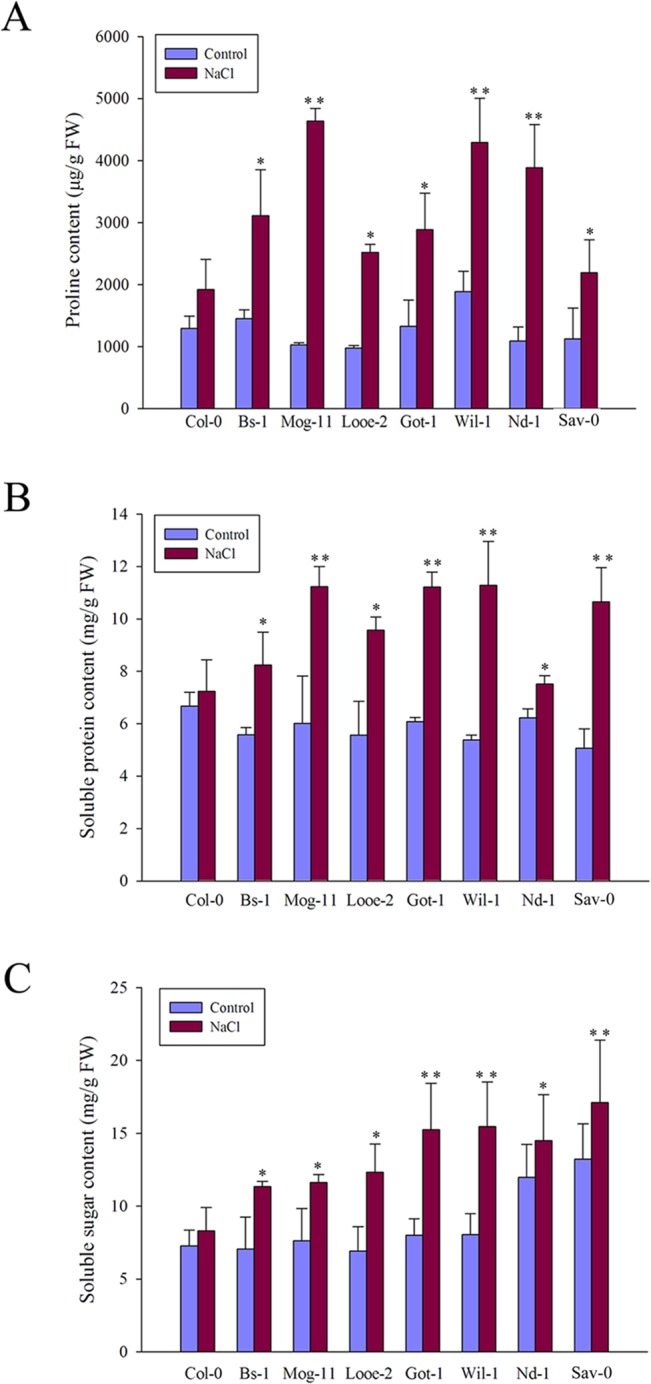
(A) The content of proline in Col-0 and the selected accessions exposed to 0 or 200 mM NaCl for 36 h. (B) The contents of soluble proteins and (C) soluble sugar in Col-0 and the selected accessions exposed to 0 or 200 mM NaCl for 12 h. Values given as mean ± SE (n = 3), each replicate comprised at least 15 seedlings. Significant differences from the performance of Col-0 accession are indicated by * or ** (P < 0.05, P < 0.01).