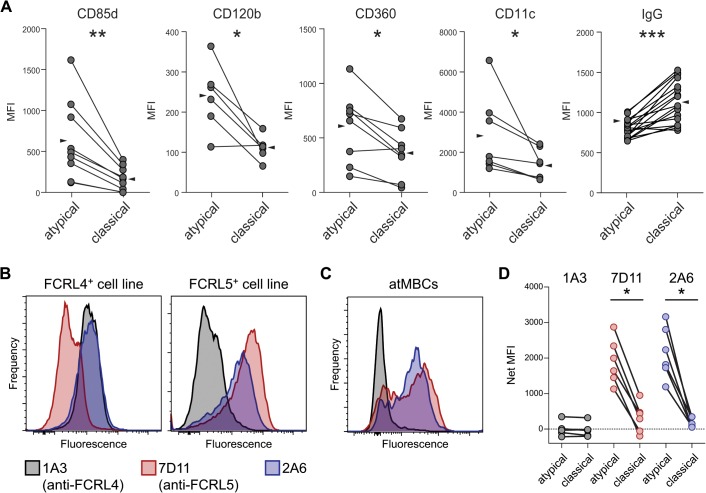
Fig 3. Phenotypic characterization of surface proteins on IgG+ atypical MBCs.
(A) Surface expression, expressed as median fluorescence intensity (MFI), of CD85d, CD120b, CD360, CD11c, and IgG (BCR) on IgG+ atMBCs and IgG+ classical MBCs. Lines between symbols denote MBC subsets from the same subject. Wedges represent means. (B) Labeling of SVT2 mouse fibroblast cell lines that express full-length human FCRL4 or FCRL5 protein by monoclonal antibodies 2A6, 1A3, and 7D11. (C) Labeling of human atMBCs with monoclonal antibodies 2A6, 1A3, and 7D11. (D) Isotype-subtracted MFI of FCRL family member expression (“Net MFI”) on atypical and classical MBCs from highly P. falciparum-exposed individuals. Statistical significance was determined using the Wilcoxon signed-rank test. *, p < 0.05; **, p < 0.01

