
Figure 2.
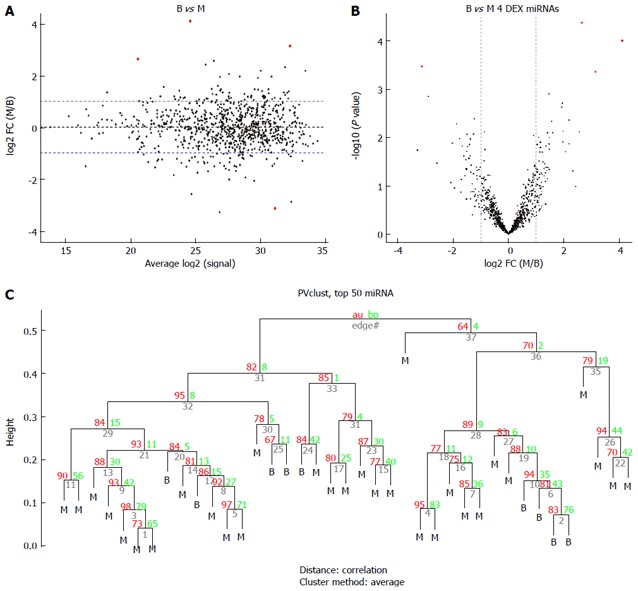
Comparison of the benign gastrointestinal stromal tumors (B group) vs the malignant gastrointestinal stromal tumors (M group). A: MA plot of assays used to profile the compared samples: fold-change (Y-axis) vs normalized Ct measurements; B: Volcano plot of the resulting P values of the t-test between the B and M groups. Four miRNAs show adjusted P values (FDR) below 0.1 and fold-changes above 2 (shown in red); C: Hierarchical clustering of the 9 benign GIST tissues and 30 malignant GIST tissues based on the 50 most variable (top 50) miRNA assays. GIST: Gastrointestinal stromal tumor; FDR: False discovery rate.