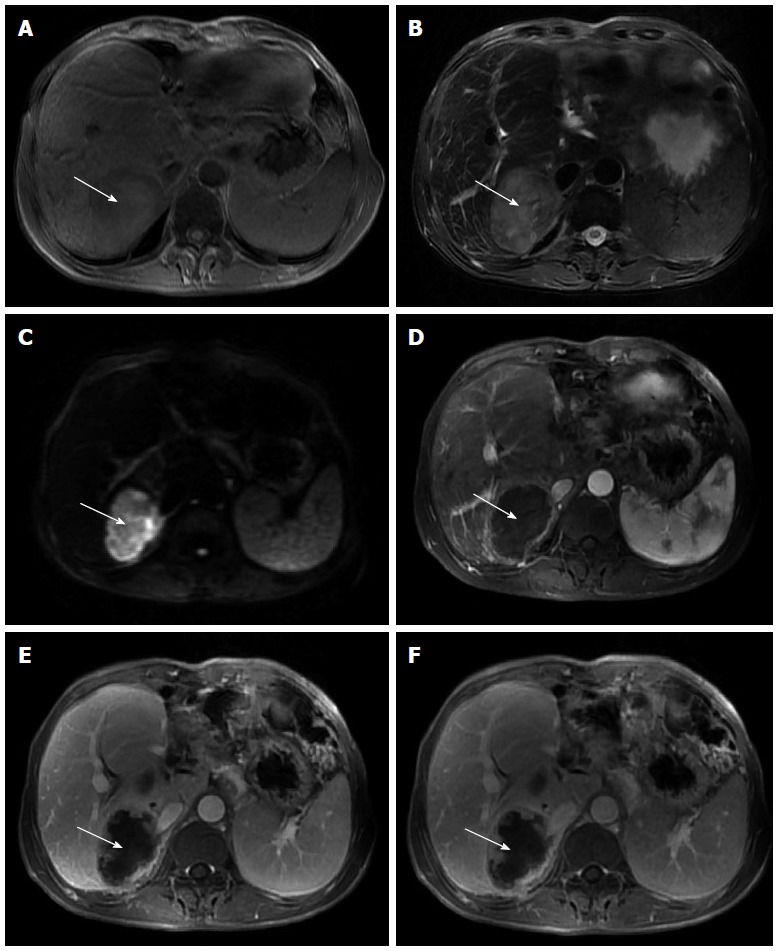
Figure 1.

Magnetic resonance imaging. A: Markedly heterogeneous low signal intensity mass (white arrow) in the right lobe of the liver on T1-weighted imaging, with focal areas of high signal intensity that indicate fresh hemorrhage; B: Heterogeneous high signal intensity mass (white arrow) in the right lobe of the liver on T2-weighted imaging, with focal areas of higher signal intensity that indicate necrosis or hemorrhage; C: Mass (white arrow) shows high signal intensity on diffusion-weighted imaging that reveals restricted diffusion; D: Mass (white arrow) has a ring-like enhancement in the arterial phase; E: Progressive enhancement of the ring (white arrow) in the portal phase, revealing nodular enhanced foci within the ring; F: Progressive enhancement of the ring (white arrow) and nodular enhanced foci within the ring in the delayed phase.
