
Figure 5.
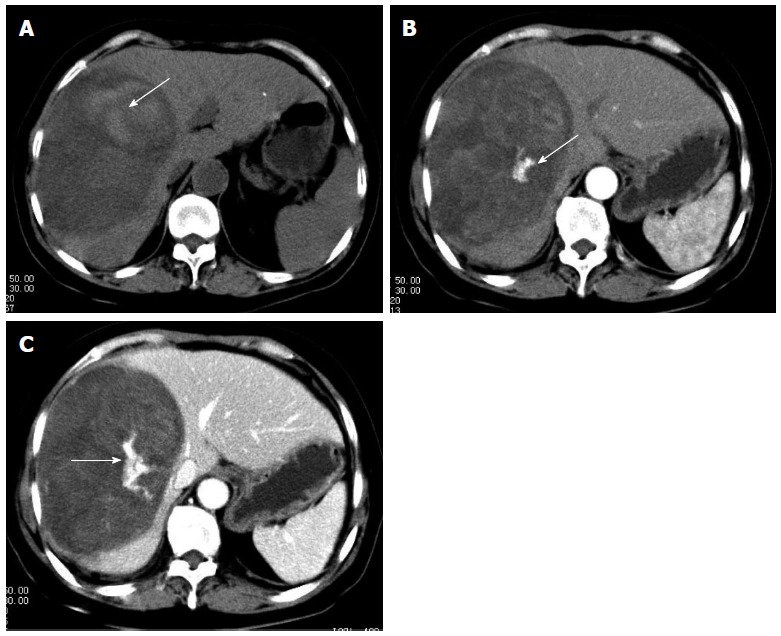
Computed tomography scan. A: Plain computed tomography scan reveals an oval shaped heterogeneous hypoattenuating mass with hyperattenuating foci (arrow) which suggests hemorrhage; B: Dominant mass lesion shows heterogenous enhancement with hyperattenuating enhanced foci (arrow), which indicate vasculature, in arterial phase; C: Dominant mass shows progressive enhancement and hyperattenuating enhanced foci enlarged in portal phase (arrows).