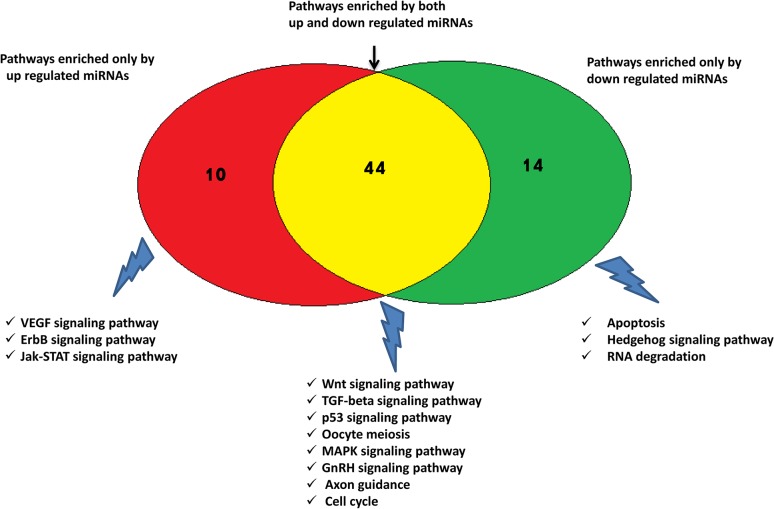
Fig 4. Venn diagram showing number of canonical pathways enriched by predicted target genes of differentially expressed miRNAs.
Representative pathways enriched by predicted target of only up regulated miRNAs (red), only down regulated miRNAs (green) and both up and down regulated miRNAs (yellow) are shown.

