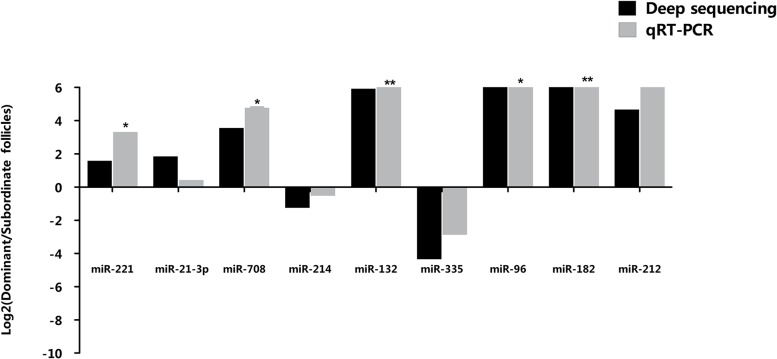
Fig 5. QPCR validation of selected candidate miRNAs differentially expressed between preovulatory dominant and subordinate follicles.
The relative abundance of individual miRNAs is presented as the ratio of preovulatory dominant and subordinate follicles. The mean expression value of target miRNA was normalized against the expression of endogenous control U6 snRNA and 5s rRNAs. The normalized miRNA expression (2-ΔCT) in preovulatory dominant follicle was divided by the normalized miRNA expression in subordinate follicle and Log2 transformed. MiRNAs with Log2 ratio > 0 are up-regulated in preovulatory dominant follicles and miRNAs with Log2 ratio < 0 are down-regulated in preovulatory dominant follicles compared to the subordinate follicles counterparts. Statistical significance of each miRNA are represented by asterisks; *, p<0.05 and **, p<0.01.

