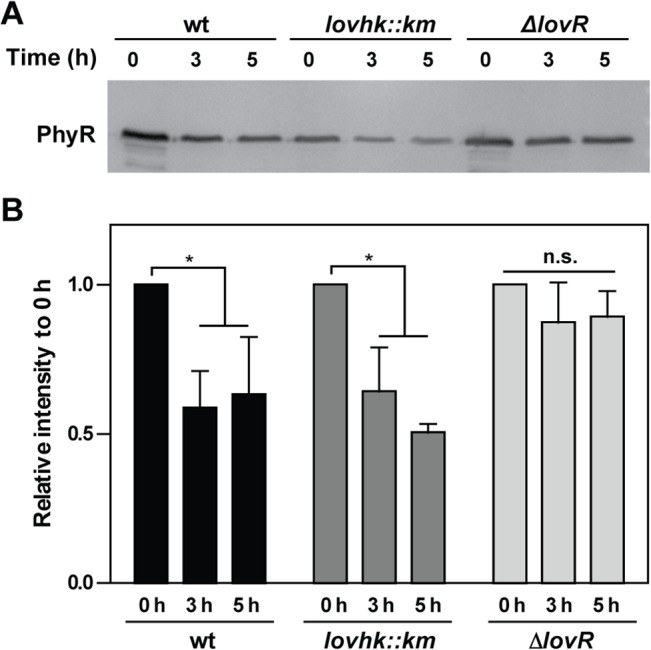
Fig 6. PhyR stability.

B. abortus 2308 wt (black bars) and the isogenic lovhk::km (dark grey bars) and ∆lovR (light grey bars) mutant strains were grown in TSB medium up to logarithmic phase. First, an aliquot was drawn (time 0 h), and then chloramphenicol was added to the rest of the culture in order to inhibit protein synthesis. Samples were taken after 3 h and 5 h. The experiment was repeated three times A. The PhyR protein abundance was analyzed by western blot, and a representative experiment is shown. B. The PhyR protein levels of the three experiments were quantified. Columns indicate the average of relative intensity to time 0 h ± standard deviation for each strain. p-values were determined by one-way ANOVA for repeated measures and a post-hoc paired t-test (* = p<0.05). PhyR: 30 kDa.
