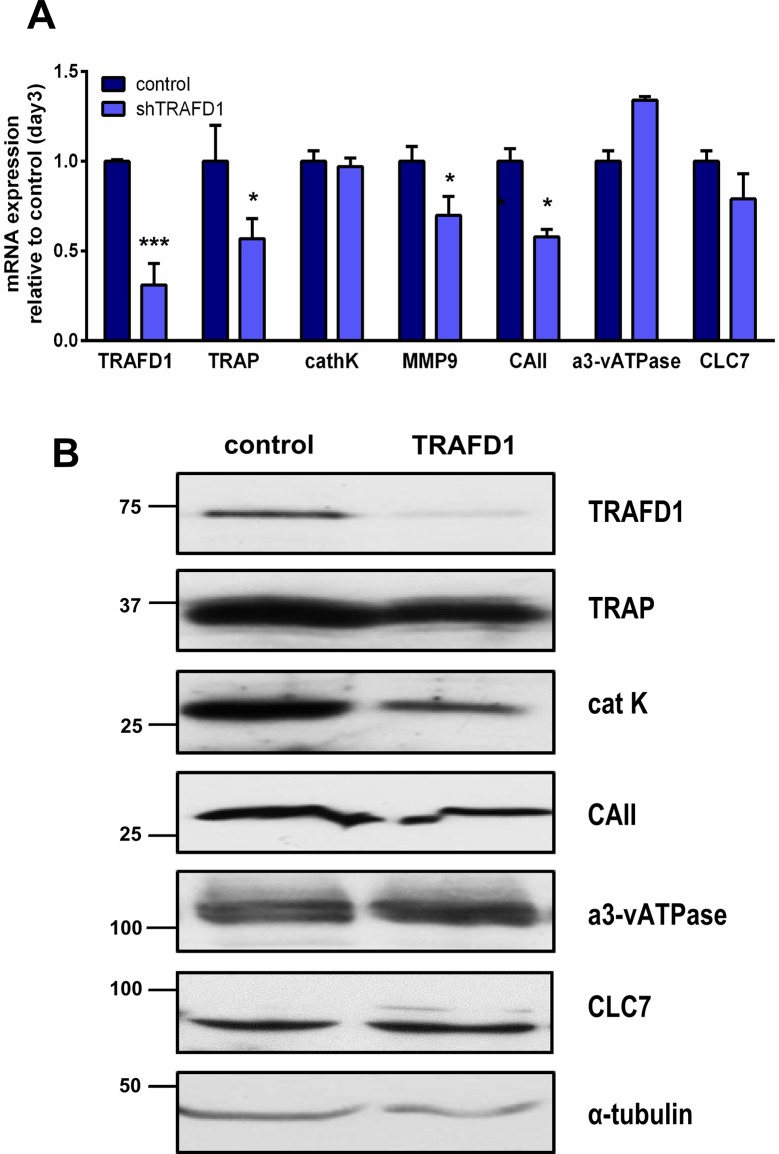
Fig 6. Decreased level of TRAFD1 has minor effects on expression of osteoclast resorption factors.
(A) Q-PCR analysis is shown for the indicated genes in differentiating shTRAFD1 cells (4 days in RANKL) vs. control cells (3 days in RANKL). The expression of each gene in shTRAFD1 cells is normalized to the expression of control cells on day 3. Student’s t-test was carried out and values are mean +s.d. of triplicate determinations in 3 independent experiments. A representative graph is shown. * P<0.05; *** P<0.0001 versus control. (B) Whole cell protein extracts from differentiated control cells (3 days in RANKL) and differentiated shTRAFD1 cells (4 days in RANKL) were subjected to immunoblotting using the antibodies shown. The experiments were performed at least 3 times and representative gels are shown.

