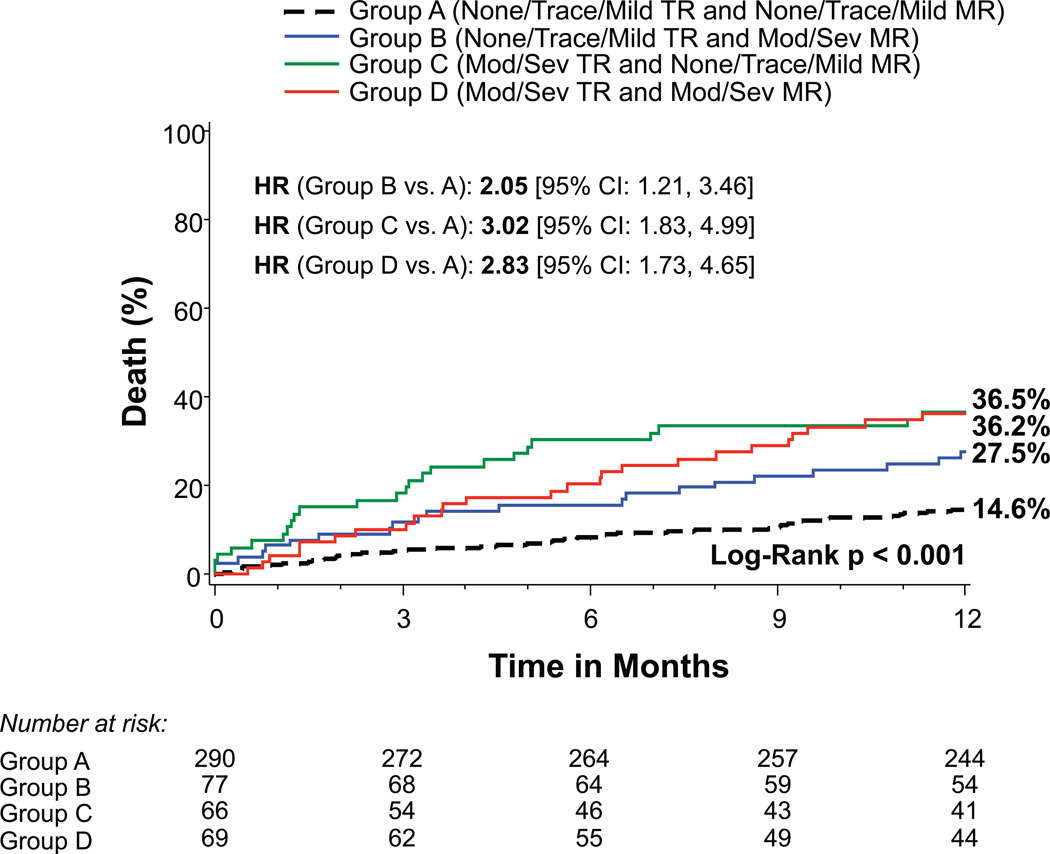
Figure 3. Time-to-event curves for 1-year death from any cause according to mitral and tricuspid regurgitation severity.
One-year time-to-event curves are shown for death from any cause in the as-treated population of the PARTNER II trial inoperable cohort for patients with no/trace/mild TR and no/trace/mild MR (Group A), no/trace/mild TR and moderate/severe MR (Group B), moderate/severe TR and no/trace/mild MR (Group C), and moderate/severe TR and moderate/severe MR (Group D). The event rates were calculated with the use of Kaplan-Meier methods and compared with the use of the log-rank test.

