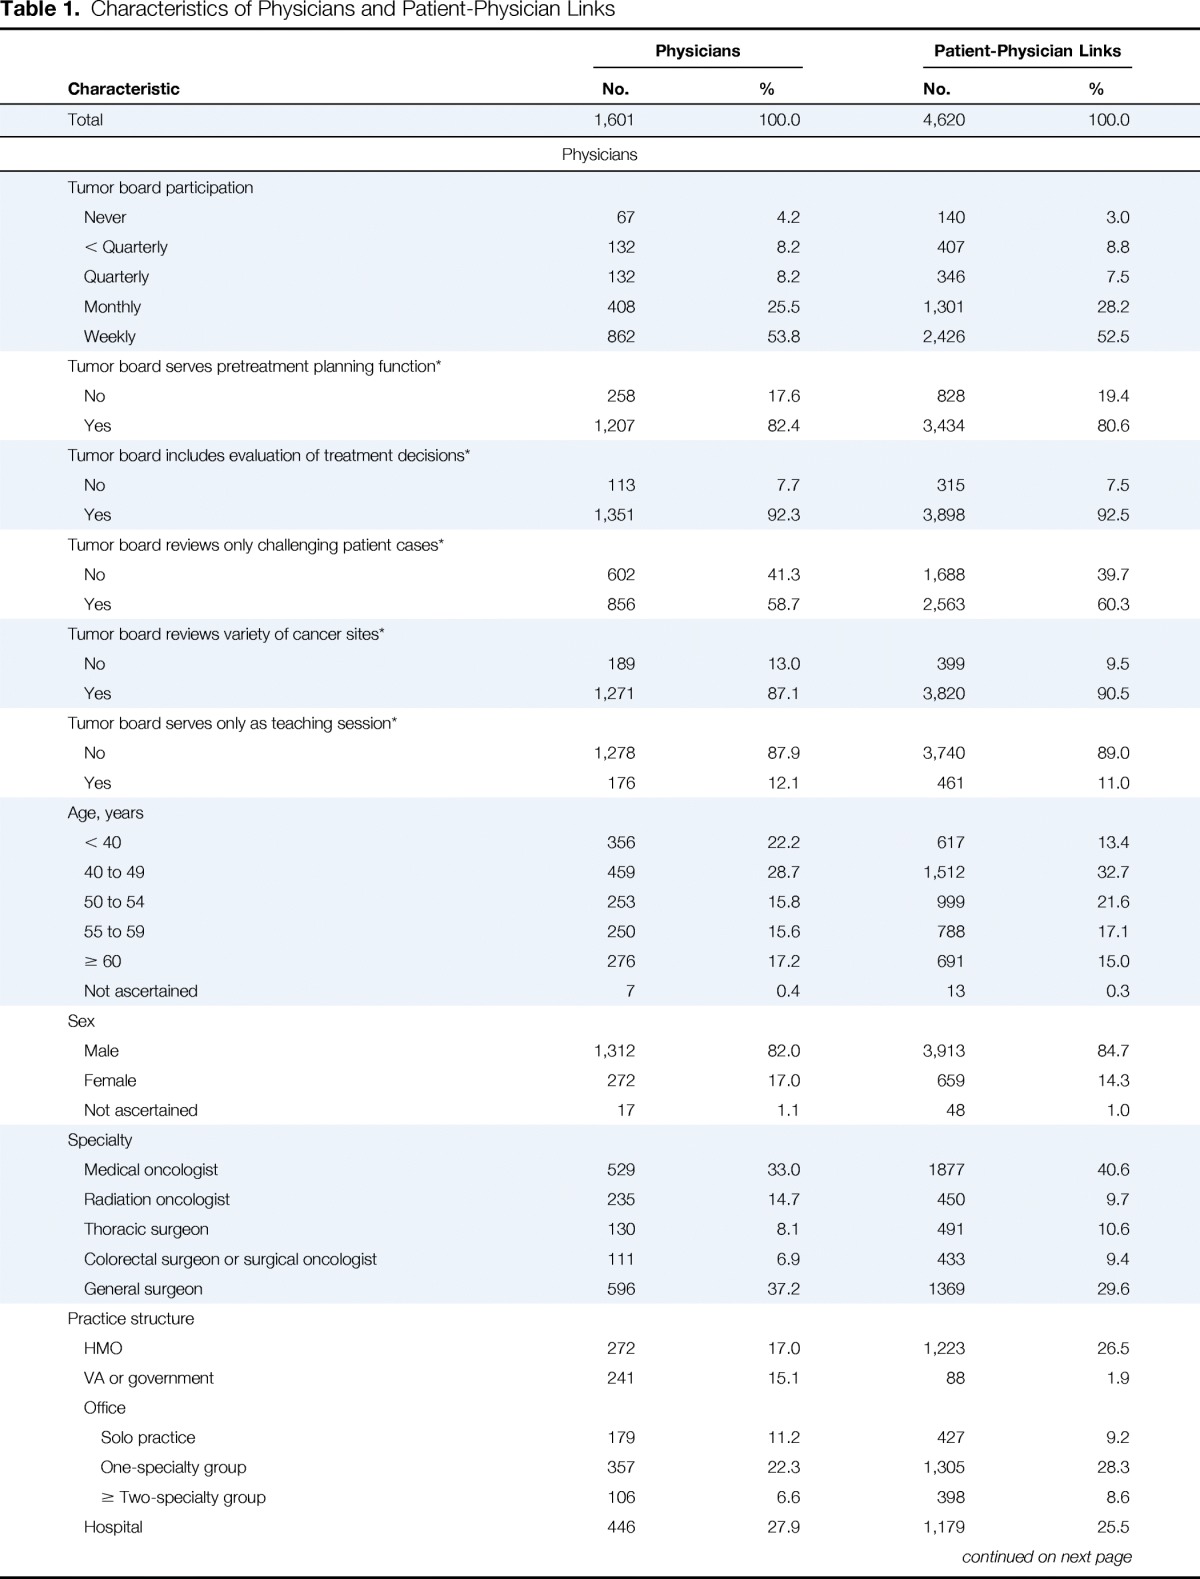
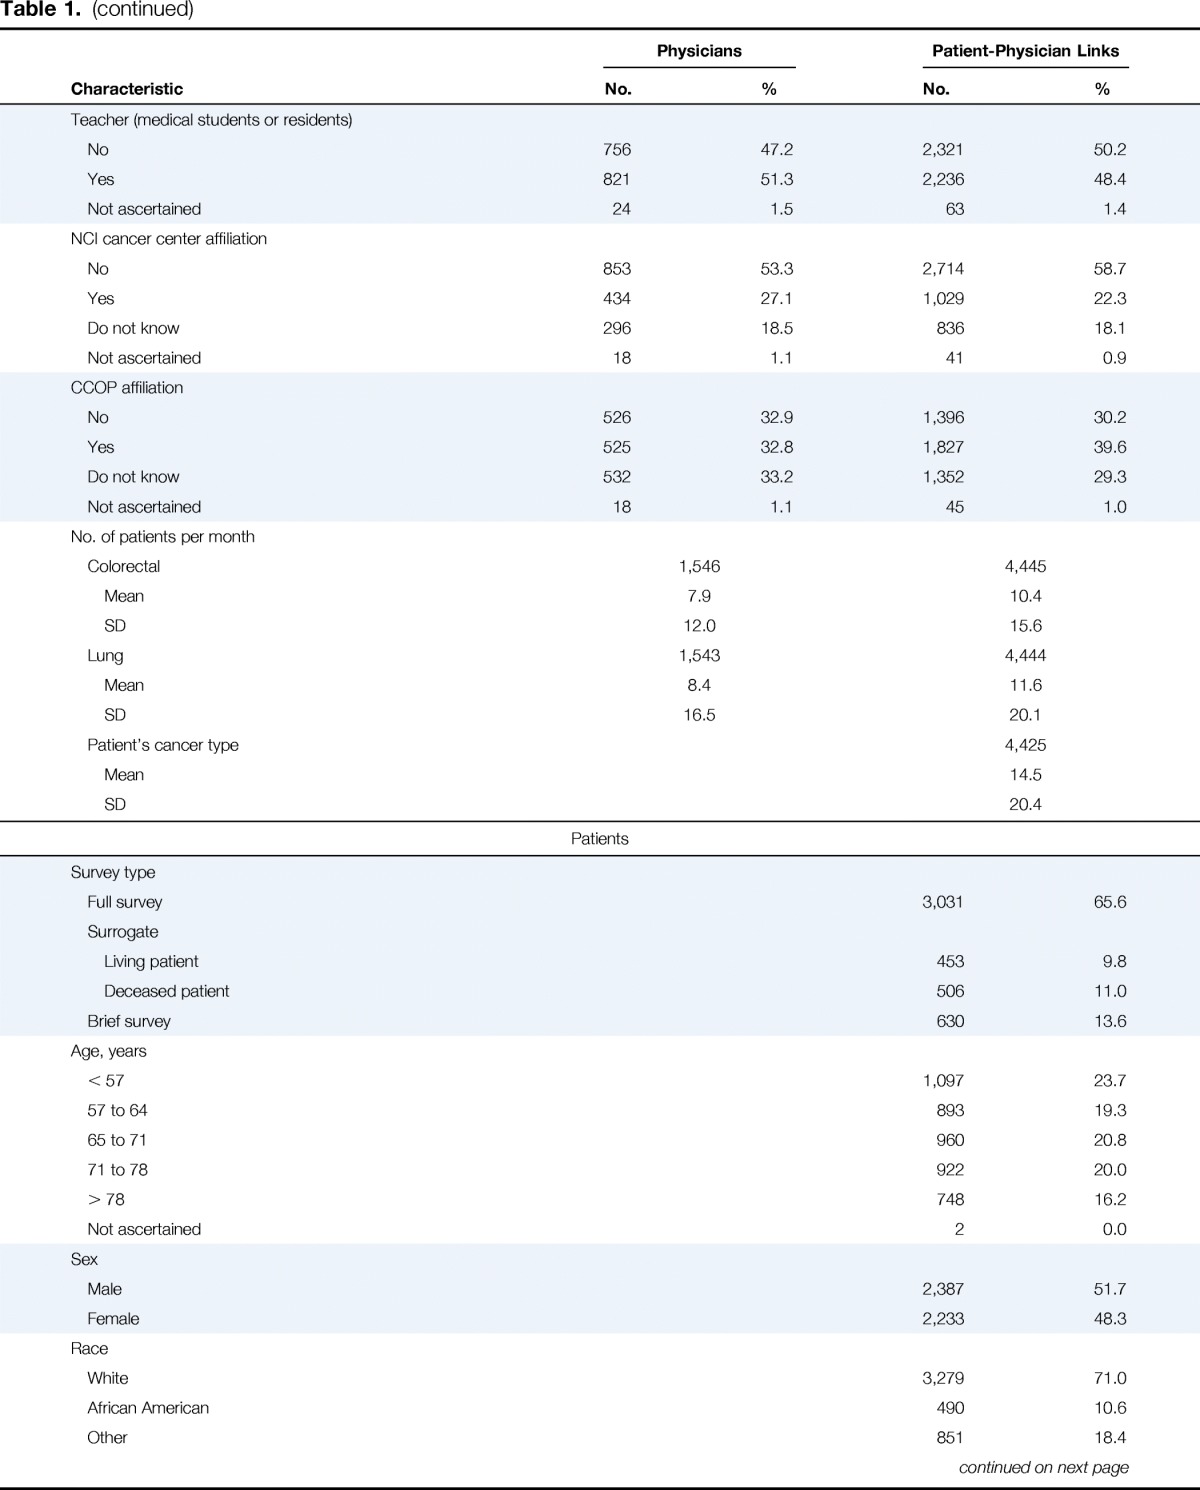
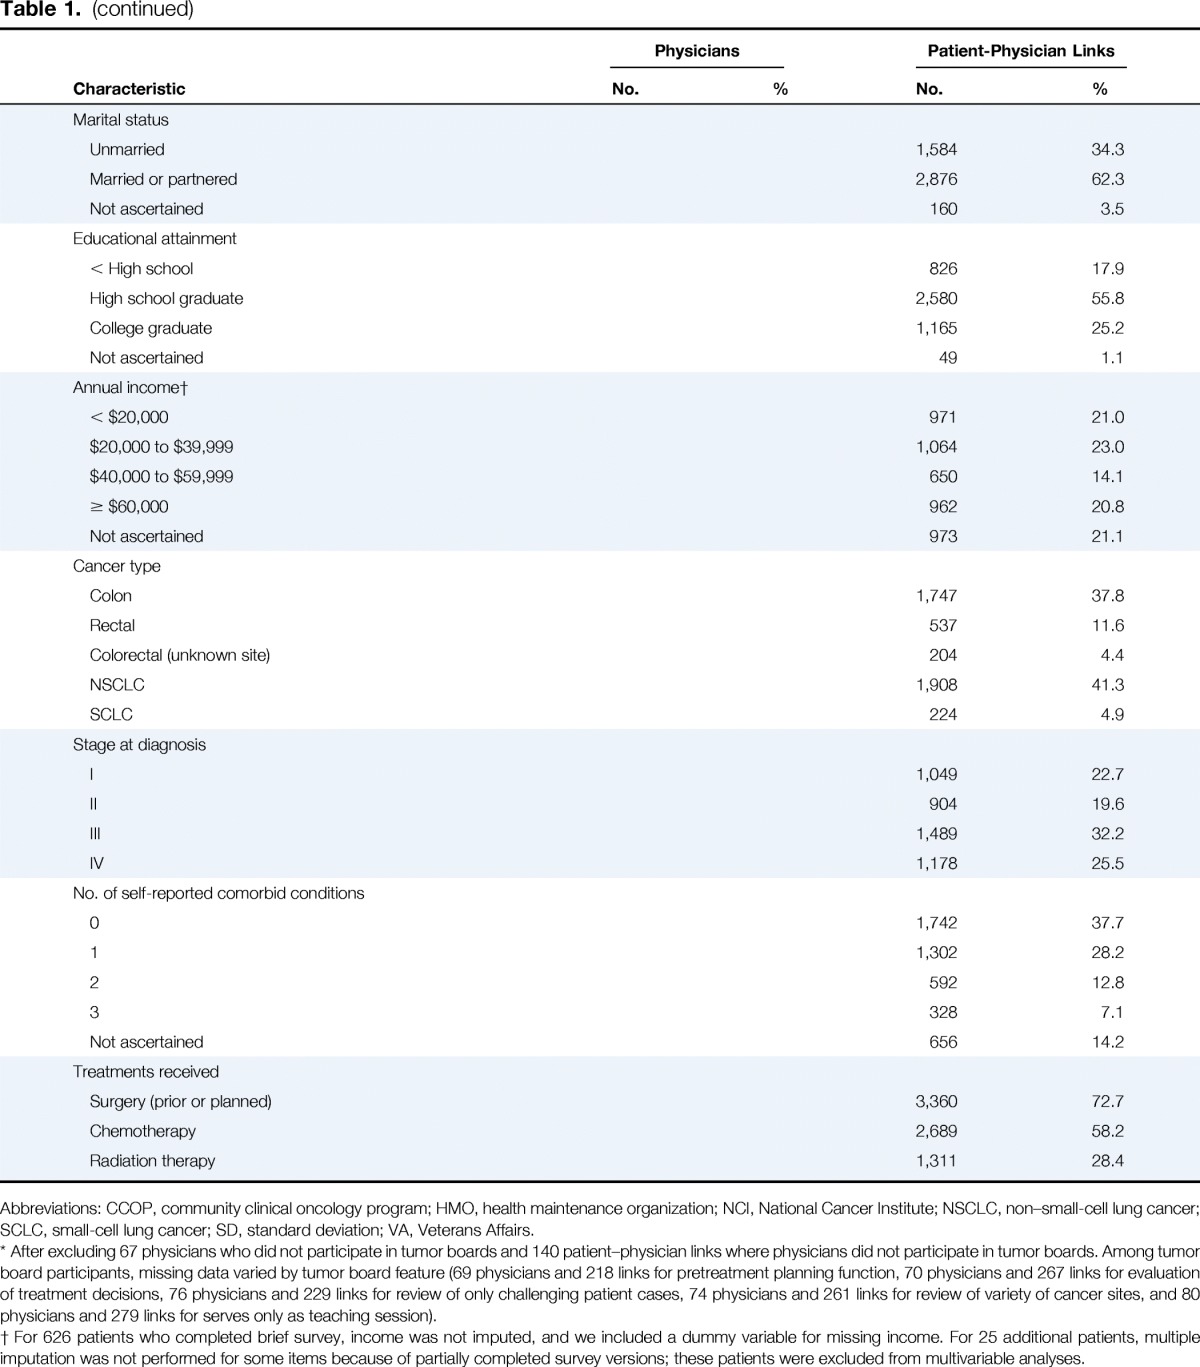
Table 1.
Characteristics of Physicians and Patient-Physician Links


| Characteristic | Physicians |
Patient-Physician Links |
||
|---|---|---|---|---|
| No. | % | No. | % | |
| Total | 1,601 | 100.0 | 4,620 | 100.0 |
| Physicians | ||||
| Tumor board participation | ||||
| Never | 67 | 4.2 | 140 | 3.0 |
| < Quarterly | 132 | 8.2 | 407 | 8.8 |
| Quarterly | 132 | 8.2 | 346 | 7.5 |
| Monthly | 408 | 25.5 | 1,301 | 28.2 |
| Weekly | 862 | 53.8 | 2,426 | 52.5 |
| Tumor board serves pretreatment planning function* | ||||
| No | 258 | 17.6 | 828 | 19.4 |
| Yes | 1,207 | 82.4 | 3,434 | 80.6 |
| Tumor board includes evaluation of treatment decisions* | ||||
| No | 113 | 7.7 | 315 | 7.5 |
| Yes | 1,351 | 92.3 | 3,898 | 92.5 |
| Tumor board reviews only challenging patient cases* | ||||
| No | 602 | 41.3 | 1,688 | 39.7 |
| Yes | 856 | 58.7 | 2,563 | 60.3 |
| Tumor board reviews variety of cancer sites* | ||||
| No | 189 | 13.0 | 399 | 9.5 |
| Yes | 1,271 | 87.1 | 3,820 | 90.5 |
| Tumor board serves only as teaching session* | ||||
| No | 1,278 | 87.9 | 3,740 | 89.0 |
| Yes | 176 | 12.1 | 461 | 11.0 |
| Age, years | ||||
| < 40 | 356 | 22.2 | 617 | 13.4 |
| 40 to 49 | 459 | 28.7 | 1,512 | 32.7 |
| 50 to 54 | 253 | 15.8 | 999 | 21.6 |
| 55 to 59 | 250 | 15.6 | 788 | 17.1 |
| ≥ 60 | 276 | 17.2 | 691 | 15.0 |
| Not ascertained | 7 | 0.4 | 13 | 0.3 |
| Sex | ||||
| Male | 1,312 | 82.0 | 3,913 | 84.7 |
| Female | 272 | 17.0 | 659 | 14.3 |
| Not ascertained | 17 | 1.1 | 48 | 1.0 |
| Specialty | ||||
| Medical oncologist | 529 | 33.0 | 1877 | 40.6 |
| Radiation oncologist | 235 | 14.7 | 450 | 9.7 |
| Thoracic surgeon | 130 | 8.1 | 491 | 10.6 |
| Colorectal surgeon or surgical oncologist | 111 | 6.9 | 433 | 9.4 |
| General surgeon | 596 | 37.2 | 1369 | 29.6 |
| Practice structure | ||||
| HMO | 272 | 17.0 | 1,223 | 26.5 |
| VA or government | 241 | 15.1 | 88 | 1.9 |
| Office | ||||
| Solo practice | 179 | 11.2 | 427 | 9.2 |
| One-specialty group | 357 | 22.3 | 1,305 | 28.3 |
| ≥ Two-specialty group | 106 | 6.6 | 398 | 8.6 |
| Hospital | 446 | 27.9 | 1,179 | 25.5 |
| Teacher (medical students or residents) | ||||
| No | 756 | 47.2 | 2,321 | 50.2 |
| Yes | 821 | 51.3 | 2,236 | 48.4 |
| Not ascertained | 24 | 1.5 | 63 | 1.4 |
| NCI cancer center affiliation | ||||
| No | 853 | 53.3 | 2,714 | 58.7 |
| Yes | 434 | 27.1 | 1,029 | 22.3 |
| Do not know | 296 | 18.5 | 836 | 18.1 |
| Not ascertained | 18 | 1.1 | 41 | 0.9 |
| CCOP affiliation | ||||
| No | 526 | 32.9 | 1,396 | 30.2 |
| Yes | 525 | 32.8 | 1,827 | 39.6 |
| Do not know | 532 | 33.2 | 1,352 | 29.3 |
| Not ascertained | 18 | 1.1 | 45 | 1.0 |
| No. of patients per month | ||||
| Colorectal | 1,546 | 4,445 | ||
| Mean | 7.9 | 10.4 | ||
| SD | 12.0 | 15.6 | ||
| Lung | 1,543 | 4,444 | ||
| Mean | 8.4 | 11.6 | ||
| SD | 16.5 | 20.1 | ||
| Patient's cancer type | 4,425 | |||
| Mean | 14.5 | |||
| SD | 20.4 | |||
| Patients | ||||
| Survey type | ||||
| Full survey | 3,031 | 65.6 | ||
| Surrogate | ||||
| Living patient | 453 | 9.8 | ||
| Deceased patient | 506 | 11.0 | ||
| Brief survey | 630 | 13.6 | ||
| Age, years | ||||
| < 57 | 1,097 | 23.7 | ||
| 57 to 64 | 893 | 19.3 | ||
| 65 to 71 | 960 | 20.8 | ||
| 71 to 78 | 922 | 20.0 | ||
| > 78 | 748 | 16.2 | ||
| Not ascertained | 2 | 0.0 | ||
| Sex | ||||
| Male | 2,387 | 51.7 | ||
| Female | 2,233 | 48.3 | ||
| Race | ||||
| White | 3,279 | 71.0 | ||
| African American | 490 | 10.6 | ||
| Other | 851 | 18.4 | ||
| Marital status | ||||
| Unmarried | 1,584 | 34.3 | ||
| Married or partnered | 2,876 | 62.3 | ||
| Not ascertained | 160 | 3.5 | ||
| Educational attainment | ||||
| < High school | 826 | 17.9 | ||
| High school graduate | 2,580 | 55.8 | ||
| College graduate | 1,165 | 25.2 | ||
| Not ascertained | 49 | 1.1 | ||
| Annual income† | ||||
| < $20,000 | 971 | 21.0 | ||
| $20,000 to $39,999 | 1,064 | 23.0 | ||
| $40,000 to $59,999 | 650 | 14.1 | ||
| ≥ $60,000 | 962 | 20.8 | ||
| Not ascertained | 973 | 21.1 | ||
| Cancer type | ||||
| Colon | 1,747 | 37.8 | ||
| Rectal | 537 | 11.6 | ||
| Colorectal (unknown site) | 204 | 4.4 | ||
| NSCLC | 1,908 | 41.3 | ||
| SCLC | 224 | 4.9 | ||
| Stage at diagnosis | ||||
| I | 1,049 | 22.7 | ||
| II | 904 | 19.6 | ||
| III | 1,489 | 32.2 | ||
| IV | 1,178 | 25.5 | ||
| No. of self-reported comorbid conditions | ||||
| 0 | 1,742 | 37.7 | ||
| 1 | 1,302 | 28.2 | ||
| 2 | 592 | 12.8 | ||
| 3 | 328 | 7.1 | ||
| Not ascertained | 656 | 14.2 | ||
| Treatments received | ||||
| Surgery (prior or planned) | 3,360 | 72.7 | ||
| Chemotherapy | 2,689 | 58.2 | ||
| Radiation therapy | 1,311 | 28.4 | ||
Abbreviations: CCOP, community clinical oncology program; HMO, health maintenance organization; NCI, National Cancer Institute; NSCLC, non–small-cell lung cancer; SCLC, small-cell lung cancer; SD, standard deviation; VA, Veterans Affairs.
After excluding 67 physicians who did not participate in tumor boards and 140 patient–physician links where physicians did not participate in tumor boards. Among tumor board participants, missing data varied by tumor board feature (69 physicians and 218 links for pretreatment planning function, 70 physicians and 267 links for evaluation of treatment decisions, 76 physicians and 229 links for review of only challenging patient cases, 74 physicians and 261 links for review of variety of cancer sites, and 80 physicians and 279 links for serves only as teaching session).
For 626 patients who completed brief survey, income was not imputed, and we included a dummy variable for missing income. For 25 additional patients, multiple imputation was not performed for some items because of partially completed survey versions; these patients were excluded from multivariable analyses.
