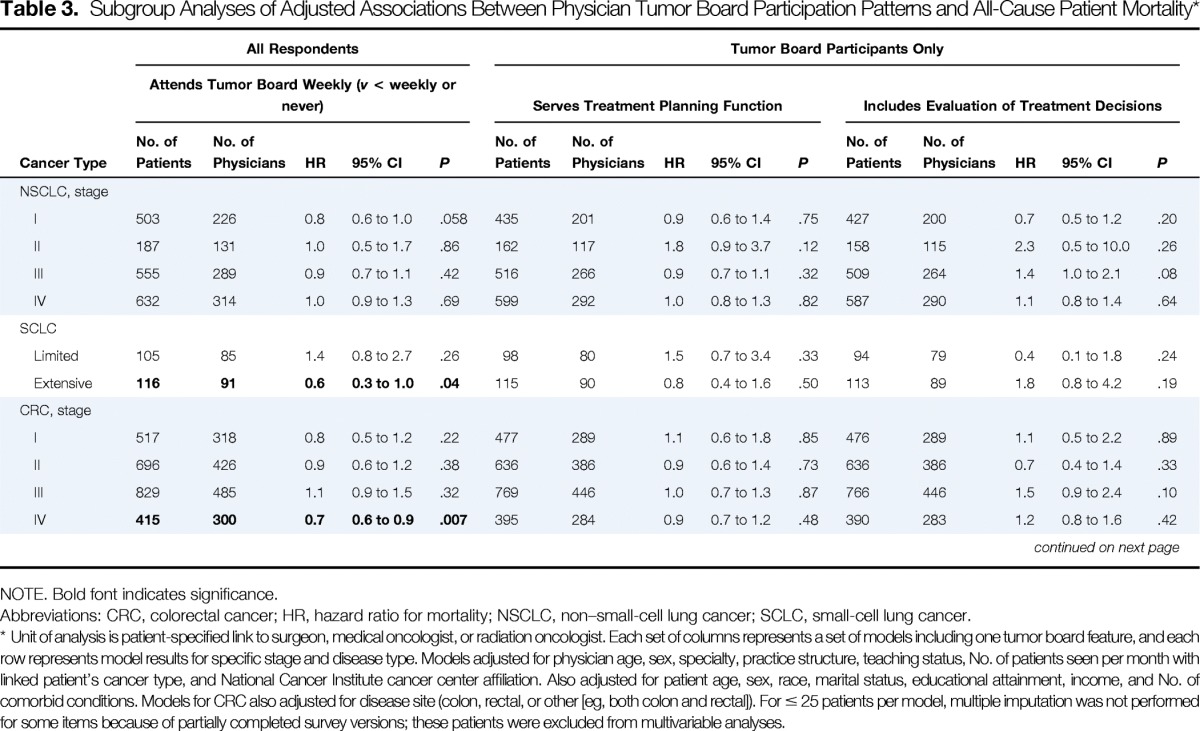
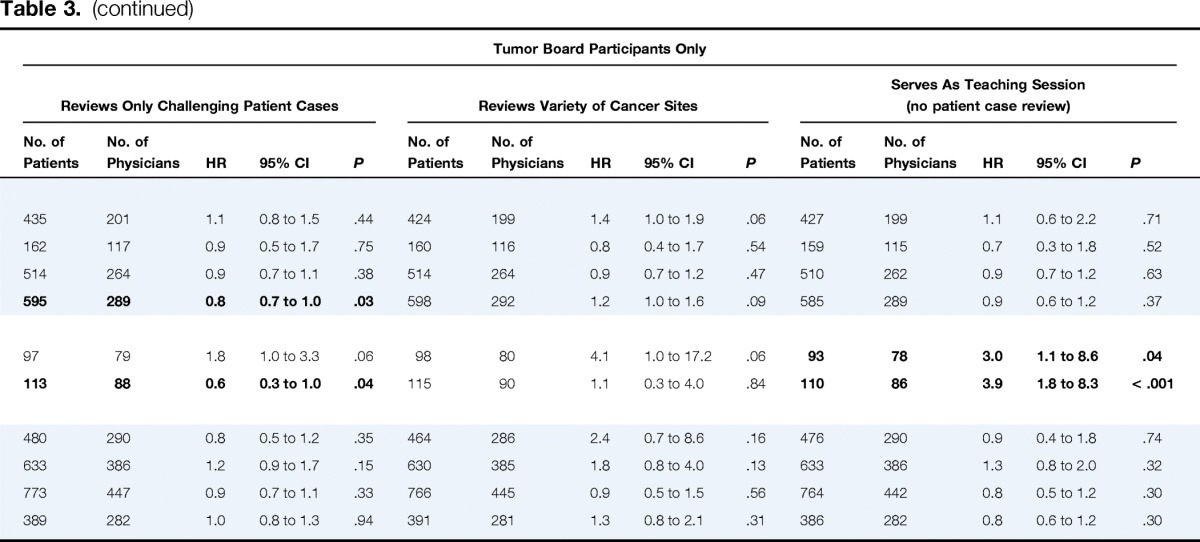
Table 3.
Subgroup Analyses of Adjusted Associations Between Physician Tumor Board Participation Patterns and All-Cause Patient Mortality*


| Cancer Type | All Respondents |
Tumor Board Participants Only |
||||||||||||||||||||||||||||
|---|---|---|---|---|---|---|---|---|---|---|---|---|---|---|---|---|---|---|---|---|---|---|---|---|---|---|---|---|---|---|
| Attends Tumor Board Weekly (v < weekly or never) |
Serves Treatment Planning Function |
Includes Evaluation of Treatment Decisions |
Reviews Only Challenging Patient Cases |
Reviews Variety of Cancer Sites |
Serves As Teaching Session (no patient case review) |
|||||||||||||||||||||||||
| No. of Patients | No. of Physicians | HR | 95% CI | P | No. of Patients | No. of Physicians | HR | 95% CI | P | No. of Patients | No. of Physicians | HR | 95% CI | P | No. of Patients | No. of Physicians | HR | 95% CI | P | No. of Patients | No. of Physicians | HR | 95% CI | P | No. of Patients | No. of Physicians | HR | 95% CI | P | |
| NSCLC, stage | ||||||||||||||||||||||||||||||
| I | 503 | 226 | 0.8 | 0.6 to 1.0 | .058 | 435 | 201 | 0.9 | 0.6 to 1.4 | .75 | 427 | 200 | 0.7 | 0.5 to 1.2 | .20 | 435 | 201 | 1.1 | 0.8 to 1.5 | .44 | 424 | 199 | 1.4 | 1.0 to 1.9 | .06 | 427 | 199 | 1.1 | 0.6 to 2.2 | .71 |
| II | 187 | 131 | 1.0 | 0.5 to 1.7 | .86 | 162 | 117 | 1.8 | 0.9 to 3.7 | .12 | 158 | 115 | 2.3 | 0.5 to 10.0 | .26 | 162 | 117 | 0.9 | 0.5 to 1.7 | .75 | 160 | 116 | 0.8 | 0.4 to 1.7 | .54 | 159 | 115 | 0.7 | 0.3 to 1.8 | .52 |
| III | 555 | 289 | 0.9 | 0.7 to 1.1 | .42 | 516 | 266 | 0.9 | 0.7 to 1.1 | .32 | 509 | 264 | 1.4 | 1.0 to 2.1 | .08 | 514 | 264 | 0.9 | 0.7 to 1.1 | .38 | 514 | 264 | 0.9 | 0.7 to 1.2 | .47 | 510 | 262 | 0.9 | 0.7 to 1.2 | .63 |
| IV | 632 | 314 | 1.0 | 0.9 to 1.3 | .69 | 599 | 292 | 1.0 | 0.8 to 1.3 | .82 | 587 | 290 | 1.1 | 0.8 to 1.4 | .64 | 595 | 289 | 0.8 | 0.7 to 1.0 | .03 | 598 | 292 | 1.2 | 1.0 to 1.6 | .09 | 585 | 289 | 0.9 | 0.6 to 1.2 | .37 |
| SCLC | ||||||||||||||||||||||||||||||
| Limited | 105 | 85 | 1.4 | 0.8 to 2.7 | .26 | 98 | 80 | 1.5 | 0.7 to 3.4 | .33 | 94 | 79 | 0.4 | 0.1 to 1.8 | .24 | 97 | 79 | 1.8 | 1.0 to 3.3 | .06 | 98 | 80 | 4.1 | 1.0 to 17.2 | .06 | 93 | 78 | 3.0 | 1.1 to 8.6 | .04 |
| Extensive | 116 | 91 | 0.6 | 0.3 to 1.0 | .04 | 115 | 90 | 0.8 | 0.4 to 1.6 | .50 | 113 | 89 | 1.8 | 0.8 to 4.2 | .19 | 113 | 88 | 0.6 | 0.3 to 1.0 | .04 | 115 | 90 | 1.1 | 0.3 to 4.0 | .84 | 110 | 86 | 3.9 | 1.8 to 8.3 | < .001 |
| CRC, stage | ||||||||||||||||||||||||||||||
| I | 517 | 318 | 0.8 | 0.5 to 1.2 | .22 | 477 | 289 | 1.1 | 0.6 to 1.8 | .85 | 476 | 289 | 1.1 | 0.5 to 2.2 | .89 | 480 | 290 | 0.8 | 0.5 to 1.2 | .35 | 464 | 286 | 2.4 | 0.7 to 8.6 | .16 | 476 | 290 | 0.9 | 0.4 to 1.8 | .74 |
| II | 696 | 426 | 0.9 | 0.6 to 1.2 | .38 | 636 | 386 | 0.9 | 0.6 to 1.4 | .73 | 636 | 386 | 0.7 | 0.4 to 1.4 | .33 | 633 | 386 | 1.2 | 0.9 to 1.7 | .15 | 630 | 385 | 1.8 | 0.8 to 4.0 | .13 | 633 | 386 | 1.3 | 0.8 to 2.0 | .32 |
| III | 829 | 485 | 1.1 | 0.9 to 1.5 | .32 | 769 | 446 | 1.0 | 0.7 to 1.3 | .87 | 766 | 446 | 1.5 | 0.9 to 2.4 | .10 | 773 | 447 | 0.9 | 0.7 to 1.1 | .33 | 766 | 445 | 0.9 | 0.5 to 1.5 | .56 | 764 | 442 | 0.8 | 0.5 to 1.2 | .30 |
| IV | 415 | 300 | 0.7 | 0.6 to 0.9 | .007 | 395 | 284 | 0.9 | 0.7 to 1.2 | .48 | 390 | 283 | 1.2 | 0.8 to 1.6 | .42 | 389 | 282 | 1.0 | 0.8 to 1.3 | .94 | 391 | 281 | 1.3 | 0.8 to 2.1 | .31 | 386 | 282 | 0.8 | 0.6 to 1.2 | .30 |
NOTE. Bold font indicates significance.
Abbreviations: CRC, colorectal cancer; HR, hazard ratio for mortality; NSCLC, non–small-cell lung cancer; SCLC, small-cell lung cancer.
Unit of analysis is patient-specified link to surgeon, medical oncologist, or radiation oncologist. Each set of columns represents a set of models including one tumor board feature, and each row represents model results for specific stage and disease type. Models adjusted for physician age, sex, specialty, practice structure, teaching status, No. of patients seen per month with linked patient's cancer type, and National Cancer Institute cancer center affiliation. Also adjusted for patient age, sex, race, marital status, educational attainment, income, and No. of comorbid conditions. Models for CRC also adjusted for disease site (colon, rectal, or other [eg, both colon and rectal]). For ≤ 25 patients per model, multiple imputation was not performed for some items because of partially completed survey versions; these patients were excluded from multivariable analyses.
