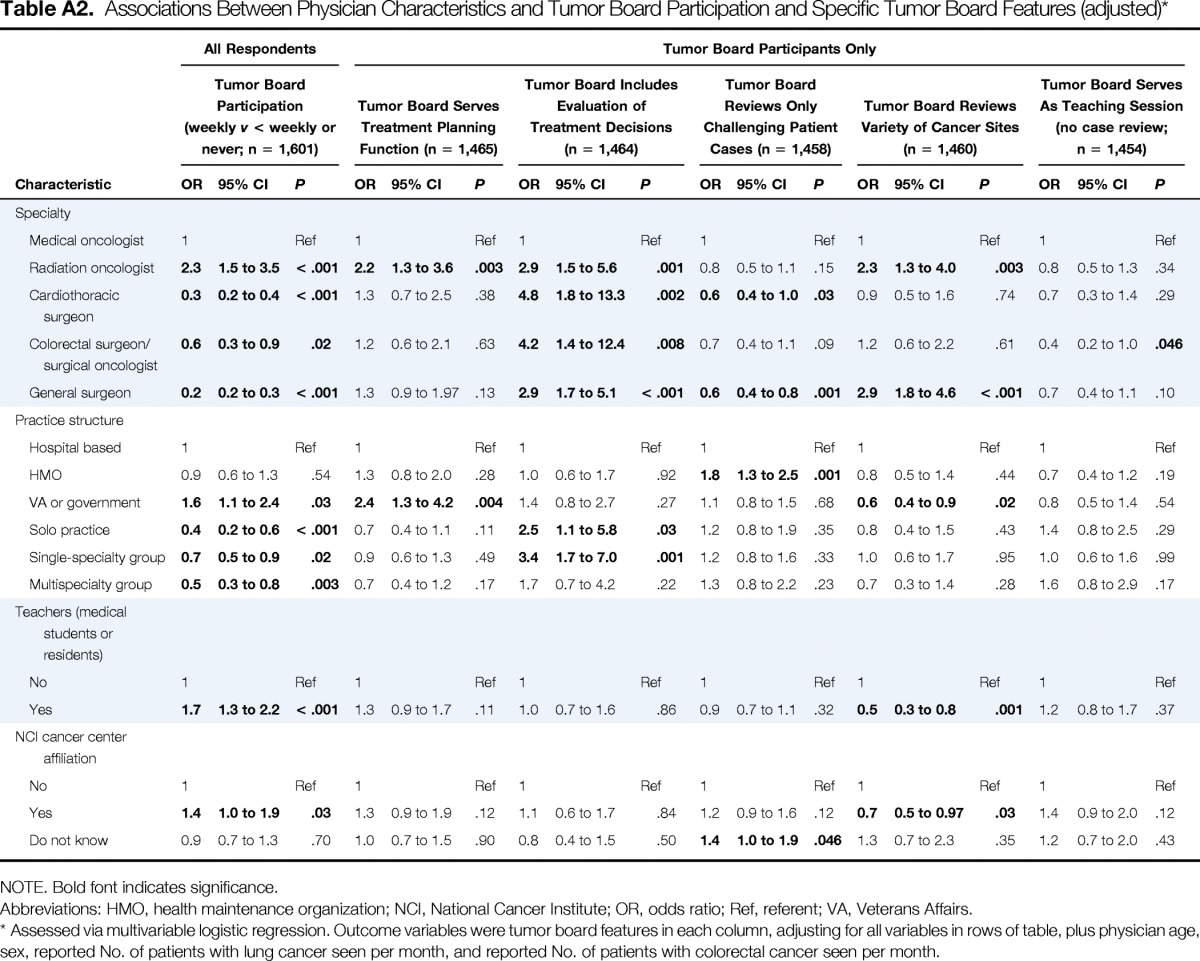
Table A2.
Associations Between Physician Characteristics and Tumor Board Participation and Specific Tumor Board Features (adjusted)*

| Characteristic | All Respondents |
Tumor Board Participants Only |
||||||||||||||||
|---|---|---|---|---|---|---|---|---|---|---|---|---|---|---|---|---|---|---|
| Tumor Board Participation (weekly v < weekly or never; n = 1,601) |
Tumor Board Serves Treatment Planning Function (n = 1,465) |
Tumor Board Includes Evaluation of Treatment Decisions (n = 1,464) |
Tumor Board Reviews Only Challenging Patient Cases (n = 1,458) |
Tumor Board Reviews Variety of Cancer Sites (n = 1,460) |
Tumor Board Serves As Teaching Session (no case review; n = 1,454) |
|||||||||||||
| OR | 95% CI | P | OR | 95% CI | P | OR | 95% CI | P | OR | 95% CI | P | OR | 95% CI | P | OR | 95% CI | P | |
| Specialty | ||||||||||||||||||
| Medical oncologist | 1 | Ref | 1 | Ref | 1 | Ref | 1 | Ref | 1 | Ref | 1 | Ref | ||||||
| Radiation oncologist | 2.3 | 1.5 to 3.5 | < .001 | 2.2 | 1.3 to 3.6 | .003 | 2.9 | 1.5 to 5.6 | .001 | 0.8 | 0.5 to 1.1 | .15 | 2.3 | 1.3 to 4.0 | .003 | 0.8 | 0.5 to 1.3 | .34 |
| Cardiothoracic surgeon | 0.3 | 0.2 to 0.4 | < .001 | 1.3 | 0.7 to 2.5 | .38 | 4.8 | 1.8 to 13.3 | .002 | 0.6 | 0.4 to 1.0 | .03 | 0.9 | 0.5 to 1.6 | .74 | 0.7 | 0.3 to 1.4 | .29 |
| Colorectal surgeon/surgical oncologist | 0.6 | 0.3 to 0.9 | .02 | 1.2 | 0.6 to 2.1 | .63 | 4.2 | 1.4 to 12.4 | .008 | 0.7 | 0.4 to 1.1 | .09 | 1.2 | 0.6 to 2.2 | .61 | 0.4 | 0.2 to 1.0 | .046 |
| General surgeon | 0.2 | 0.2 to 0.3 | < .001 | 1.3 | 0.9 to 1.97 | .13 | 2.9 | 1.7 to 5.1 | < .001 | 0.6 | 0.4 to 0.8 | .001 | 2.9 | 1.8 to 4.6 | < .001 | 0.7 | 0.4 to 1.1 | .10 |
| Practice structure | ||||||||||||||||||
| Hospital based | 1 | Ref | 1 | Ref | 1 | Ref | 1 | Ref | 1 | Ref | 1 | Ref | ||||||
| HMO | 0.9 | 0.6 to 1.3 | .54 | 1.3 | 0.8 to 2.0 | .28 | 1.0 | 0.6 to 1.7 | .92 | 1.8 | 1.3 to 2.5 | .001 | 0.8 | 0.5 to 1.4 | .44 | 0.7 | 0.4 to 1.2 | .19 |
| VA or government | 1.6 | 1.1 to 2.4 | .03 | 2.4 | 1.3 to 4.2 | .004 | 1.4 | 0.8 to 2.7 | .27 | 1.1 | 0.8 to 1.5 | .68 | 0.6 | 0.4 to 0.9 | .02 | 0.8 | 0.5 to 1.4 | .54 |
| Solo practice | 0.4 | 0.2 to 0.6 | < .001 | 0.7 | 0.4 to 1.1 | .11 | 2.5 | 1.1 to 5.8 | .03 | 1.2 | 0.8 to 1.9 | .35 | 0.8 | 0.4 to 1.5 | .43 | 1.4 | 0.8 to 2.5 | .29 |
| Single-specialty group | 0.7 | 0.5 to 0.9 | .02 | 0.9 | 0.6 to 1.3 | .49 | 3.4 | 1.7 to 7.0 | .001 | 1.2 | 0.8 to 1.6 | .33 | 1.0 | 0.6 to 1.7 | .95 | 1.0 | 0.6 to 1.6 | .99 |
| Multispecialty group | 0.5 | 0.3 to 0.8 | .003 | 0.7 | 0.4 to 1.2 | .17 | 1.7 | 0.7 to 4.2 | .22 | 1.3 | 0.8 to 2.2 | .23 | 0.7 | 0.3 to 1.4 | .28 | 1.6 | 0.8 to 2.9 | .17 |
| Teachers (medical students or residents) | ||||||||||||||||||
| No | 1 | Ref | 1 | Ref | 1 | Ref | 1 | Ref | 1 | Ref | 1 | Ref | ||||||
| Yes | 1.7 | 1.3 to 2.2 | < .001 | 1.3 | 0.9 to 1.7 | .11 | 1.0 | 0.7 to 1.6 | .86 | 0.9 | 0.7 to 1.1 | .32 | 0.5 | 0.3 to 0.8 | .001 | 1.2 | 0.8 to 1.7 | .37 |
| NCI cancer center affiliation | ||||||||||||||||||
| No | 1 | Ref | 1 | Ref | 1 | Ref | 1 | Ref | 1 | Ref | 1 | Ref | ||||||
| Yes | 1.4 | 1.0 to 1.9 | .03 | 1.3 | 0.9 to 1.9 | .12 | 1.1 | 0.6 to 1.7 | .84 | 1.2 | 0.9 to 1.6 | .12 | 0.7 | 0.5 to 0.97 | .03 | 1.4 | 0.9 to 2.0 | .12 |
| Do not know | 0.9 | 0.7 to 1.3 | .70 | 1.0 | 0.7 to 1.5 | .90 | 0.8 | 0.4 to 1.5 | .50 | 1.4 | 1.0 to 1.9 | .046 | 1.3 | 0.7 to 2.3 | .35 | 1.2 | 0.7 to 2.0 | .43 |
NOTE. Bold font indicates significance.
Abbreviations: HMO, health maintenance organization; NCI, National Cancer Institute; OR, odds ratio; Ref, referent; VA, Veterans Affairs.
Assessed via multivariable logistic regression. Outcome variables were tumor board features in each column, adjusting for all variables in rows of table, plus physician age, sex, reported No. of patients with lung cancer seen per month, and reported No. of patients with colorectal cancer seen per month.
