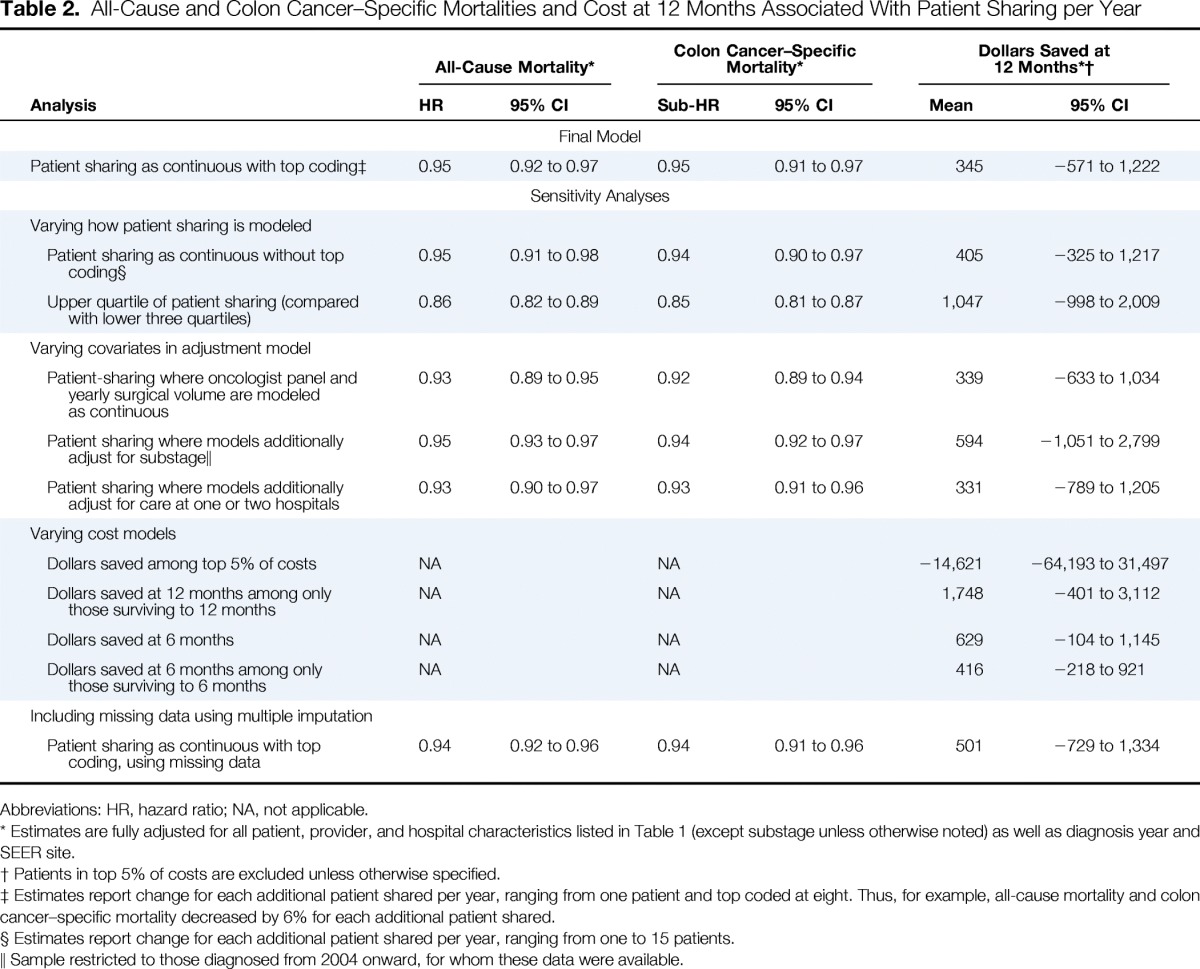
Table 2.
All-Cause and Colon Cancer–Specific Mortalities and Cost at 12 Months Associated With Patient Sharing per Year

| Analysis | All-Cause Mortality* |
Colon Cancer–Specific Mortality* |
Dollars Saved at 12 Months*† |
|||
|---|---|---|---|---|---|---|
| HR | 95% CI | Sub-HR | 95% CI | Mean | 95% CI | |
| Final Model | ||||||
| Patient sharing as continuous with top coding‡ | 0.95 | 0.92 to 0.97 | 0.95 | 0.91 to 0.97 | 345 | −571 to 1,222 |
| Sensitivity Analyses | ||||||
| Varying how patient sharing is modeled | ||||||
| Patient sharing as continuous without top coding§ | 0.95 | 0.91 to 0.98 | 0.94 | 0.90 to 0.97 | 405 | −325 to 1,217 |
| Upper quartile of patient sharing (compared with lower three quartiles) | 0.86 | 0.82 to 0.89 | 0.85 | 0.81 to 0.87 | 1,047 | −998 to 2,009 |
| Varying covariates in adjustment model | ||||||
| Patient-sharing where oncologist panel and yearly surgical volume are modeled as continuous | 0.93 | 0.89 to 0.95 | 0.92 | 0.89 to 0.94 | 339 | −633 to 1,034 |
| Patient sharing where models additionally adjust for substage‖ | 0.95 | 0.93 to 0.97 | 0.94 | 0.92 to 0.97 | 594 | −1,051 to 2,799 |
| Patient sharing where models additionally adjust for care at one or two hospitals | 0.93 | 0.90 to 0.97 | 0.93 | 0.91 to 0.96 | 331 | −789 to 1,205 |
| Varying cost models | ||||||
| Dollars saved among top 5% of costs | NA | NA | −14,621 | −64,193 to 31,497 | ||
| Dollars saved at 12 months among only those surviving to 12 months | NA | NA | 1,748 | −401 to 3,112 | ||
| Dollars saved at 6 months | NA | NA | 629 | −104 to 1,145 | ||
| Dollars saved at 6 months among only those surviving to 6 months | NA | NA | 416 | −218 to 921 | ||
| Including missing data using multiple imputation | ||||||
| Patient sharing as continuous with top coding, using missing data | 0.94 | 0.92 to 0.96 | 0.94 | 0.91 to 0.96 | 501 | −729 to 1,334 |
Abbreviations: HR, hazard ratio; NA, not applicable.
Estimates are fully adjusted for all patient, provider, and hospital characteristics listed in Table 1 (except substage unless otherwise noted) as well as diagnosis year and SEER site.
Patients in top 5% of costs are excluded unless otherwise specified.
Estimates report change for each additional patient shared per year, ranging from one patient and top coded at eight. Thus, for example, all-cause mortality and colon cancer–specific mortality decreased by 6% for each additional patient shared.
Estimates report change for each additional patient shared per year, ranging from one to 15 patients.
Sample restricted to those diagnosed from 2004 onward, for whom these data were available.
