
Figure 3.
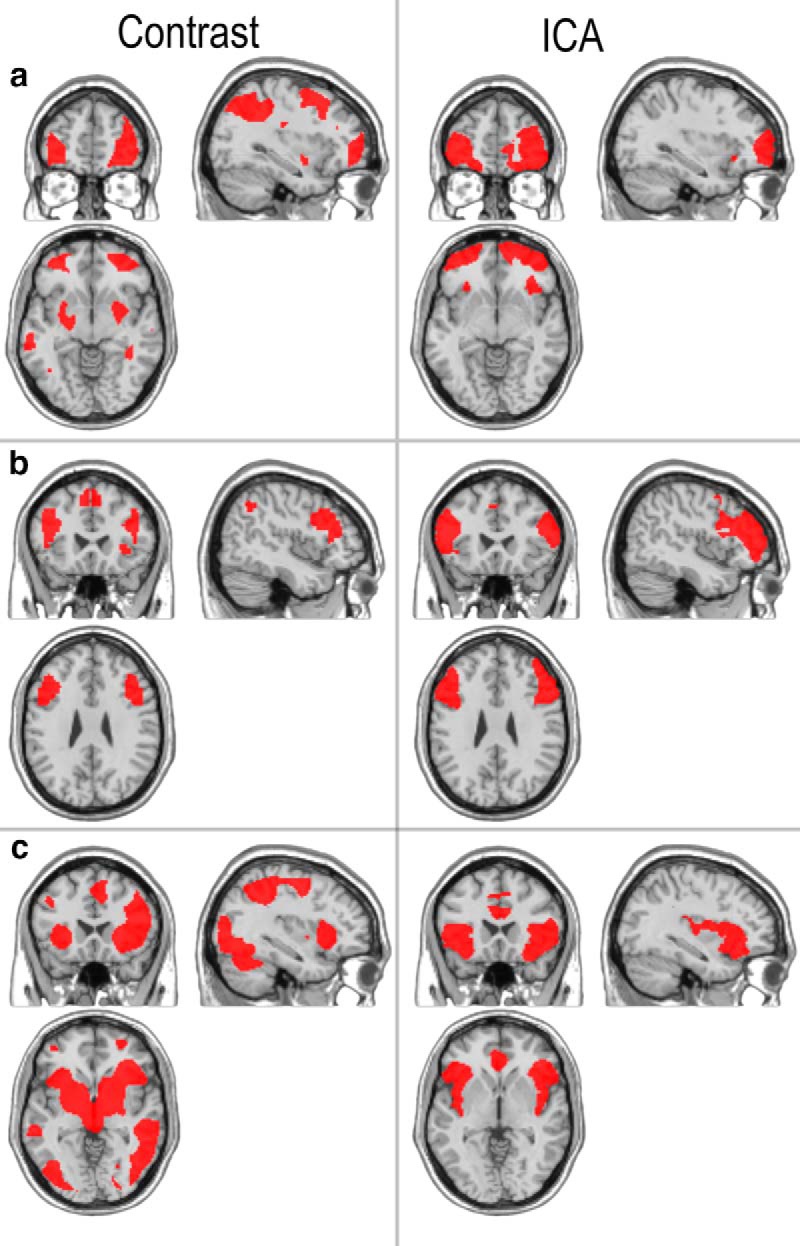
Comparisons between ICA components and representative contrasts reported in previous publications. a, On the right is the LFPC ICA cluster and on the left is the pattern of activation observed during contingency reversal learning (Hampshire et al., 2006). b, On the right is the IFS ICA cluster and on the left is the “Reasoning” component from a recent study comparing activations across 12 challenging cognitive tasks (Hampshire et al., 2012). c, On the right is the AIFO ICA cluster and to the left is a contrast of targets minus distractors during target detection (Hampshire et al., 2007). All contrasts are thresholded at p < 0.05 false-discovery rate corrected for the whole brain mass.