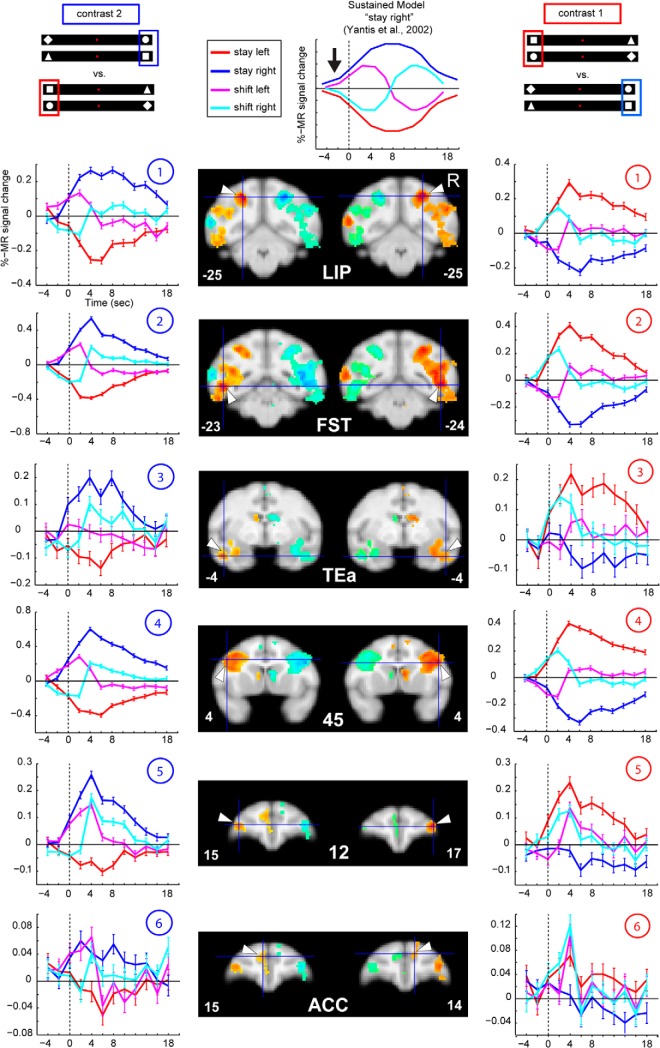
Figure 4.
Contralateral modulation of attention, cortical areas. Group MFX data in 112-RM atlas (McLaren et al., 2009) aligned to the F99 group space (anterior/posterior levels in coronal slices indicated with respect to the anterior commissure), thresholded at p = 0.001 (uncorrected), cluster extent threshold of 10 voxels. Middle left panels (contrast 2), Hot colors represent activations for stay right versus stay left. Cold colors represent deactivations for stay right versus stay left. Middle right panels (contrast 1), Hot colors represent activations for stay left versus stay right. Cold colors represent deactivations for stay left versus stay right. PSC plotted from raw time courses against the baseline (null events), of the ROIs indicated with the white arrows. The polarity of all signal change values has been inverted, as increase in signal produces decrease in the MION CBV maps (see Materials and Methods). Numbers indicate the ROI locations on the flatmap in Figure 3. Middle/top, For illustrative purposes, we depict the “sustained model” (example for “right attention”) (adapted from Yantis et al., 2002).

