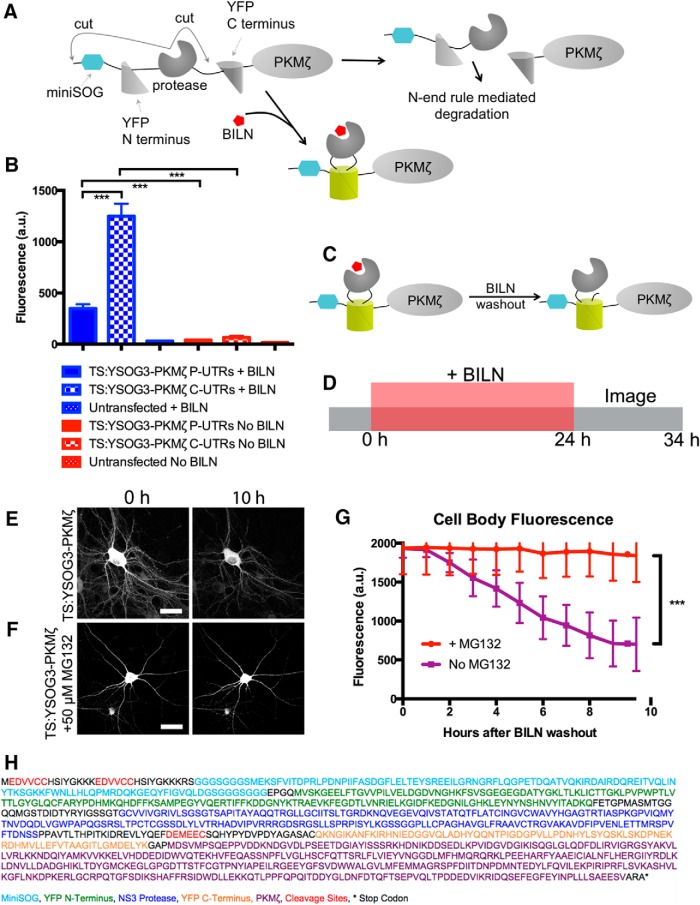
Figure 1.
Development of TS:YSOG3 and effect of 5′ and 3′ UTRs on PKMζ expression. A, TS:YSOG3 fused to PKMζ, before and after BILN. B, YFP fluorescence quantification in neurons transfected with TS:YSOG3-PKMζ with the PKMζ and control and without 5′ and 3′ UTRs and in untransfected neurons, in the presence and absence of BILN. ***p < 0.001 (unpaired two-tailed Student's t test). n = 23, 19, 22, 18, 15, and 17 neurons per condition, respectively. Error bars indicate SEM. C, YFP complementation and maintenance after BILN addition and washout. D, Schematic indicating treatment with BILN for 24 h, then imaging for 10 h (once per hour) following BILN washout. E, Neurons imaged for 10 h after BILN washout show a loss in TS:YSOG3-PKMζ fluorescence, indicating degradation over time. F, Neurons visualized for 10 h after BILN washout with MG132 added immediately after washout do not show TS:YSOG3-PKMζ loss in fluorescence, indicating that proteasomal inhibition prevented TS:YSOG3-PKMζ from degrading. G, Fluorescence quantification of cell bodies with and without MG132 added at BILN washout. ***p < 0.001 (unpaired two-tailed Student's t test). n = 10 MG132 treated neurons; n = 7 untreated neurons. Error bars indicate SEM. Scale bars, 20 μm. H, TS:YSOG3-PKMζ amino acid sequence.

