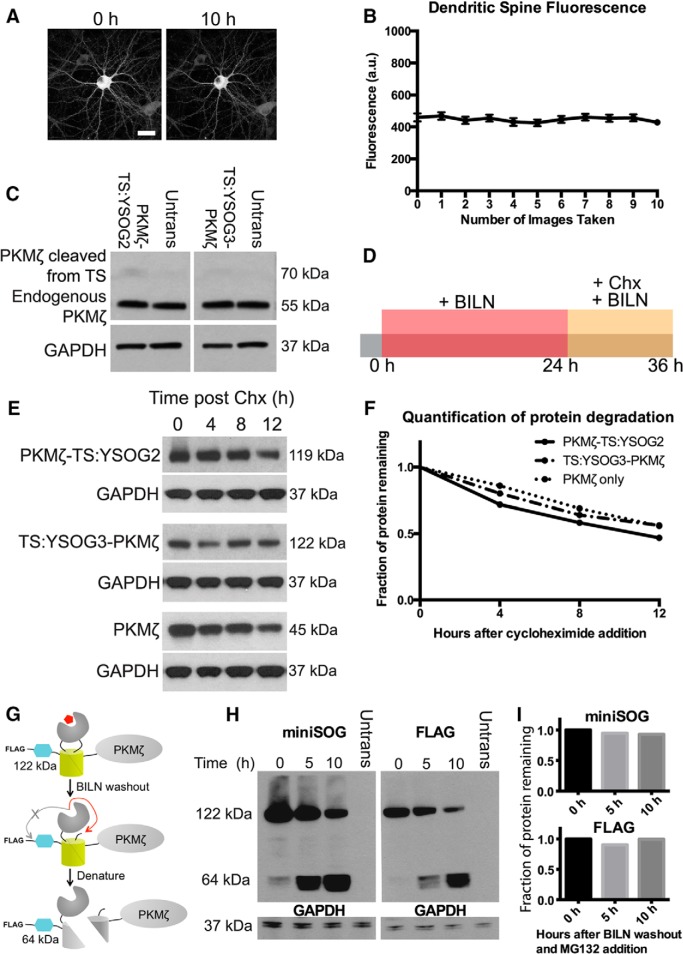
Figure 2.
YFP imaging and TS fusion protein expression do not affect characterization of PKMζ dynamics in neurons. A, Neurons expressing PKMζ-YFP imaged 10 times show no fluorescence bleaching after image acquisition. B, Fluorescence quantification in dendritic spines over the 10 h imaging period indicates that no fluorescence loss occurred. Error bars indicate SEM. C, Neurons were transfected with PKMζ-TS:YSOG2, TS:YSOG3-PKMζ, or left untransfected (Untrans) and immunoblotted for PKMζ to compare levels of endogenous and TS-driven PKMζ production. D, Schematic indicating how transfected neurons were treated with BILN for 24 h and then with 50 μg/ml cycloheximide without removing BILN. This blocked new protein synthesis while preventing protease reactivation. Neurons were lysed at 0, 4, 8, and 12 h after cycloheximide addition. E, Western blots tracking PKMζ-TS:YSOG2 and TS:YSOG3-PKMζ using an antibody specific for miniSOG and PKMζ fused only to the T7 epitope tag using an antibody specific for the T7 epitope, performed as described in D; blots demonstrate that each protein degrades similarly. GAPDH was used as a loading control. F, Quantitative analysis of Western blots in E; band intensities were normalized to GAPDH for each lane and plotted as the fraction of protein remaining over time. G, FLAG-TS:YSOG3-PKMζ fusion protein after BILN addition for labeling, after subsequent BILN washout, and after exposure to denaturing conditions. H, Western blots using antibodies specific for miniSOG and the FLAG epitope tag performed on HEK-293A cells expressing FLAG-TS:YSOG3-PKMζ, lysed at 0, 5, and 10 h after BILN washout and simultaneous MG132 addition to visualize all TS peptides. I, Quantitative analysis of Western blots in H; band intensities were normalized to GAPDH for each lane and plotted as the fraction of protein remaining over time.

