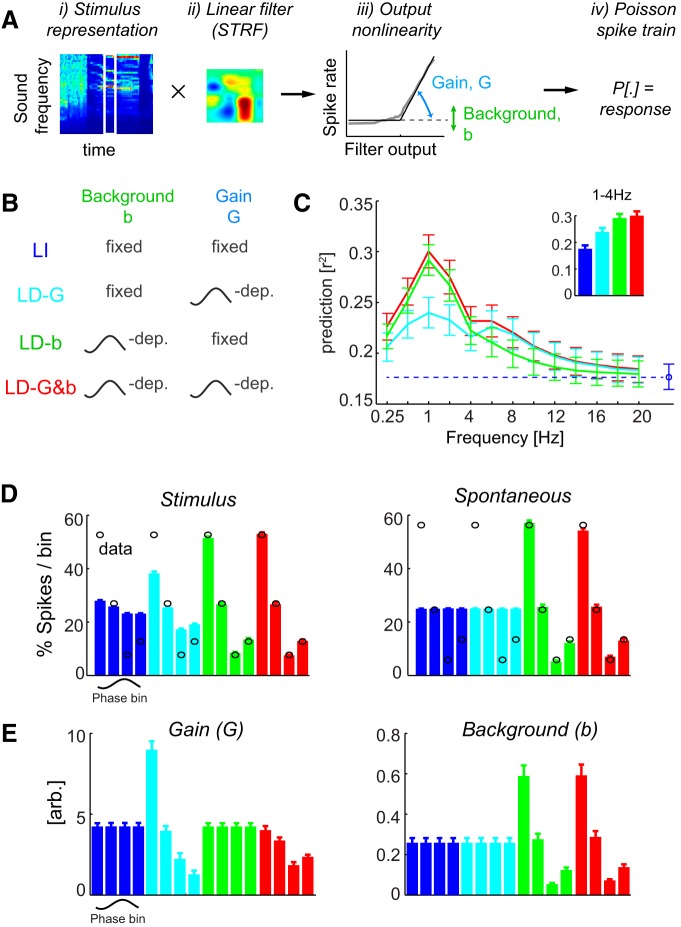
Figure 2.
Response prediction using phase-dependent LNP models. A, Schematic of the LNP model transforming the spectrotemporal stimulus representation using a linear filter into a predicted response. The filter activation is passed through an output nonlinearity characterized by two parameters (G and b) and is used as input for a Poisson spike generator. B, Schematic of the different models. For additional details, see Materials and Methods. C, Prediction quality (cross-validated) for each model relative to the phase of different frequency bands. Inset, Prediction quality relative to the delta band (1–4 Hz). D, Distribution of spikes relative to delta phase during stimulus epochs and spontaneous activity for each model (bars) and the actual data (black circles). Each bar corresponds to the firing rate in one phase bin. Note that the LI and LD-G models by definition predict the same rate across bins. E, Gain and background parameters obtained from each model relative to delta. Each parameter is shown for each phase bin, but some models by definition use the same parameter across bins. Error bars denote mean and SEM across units.

