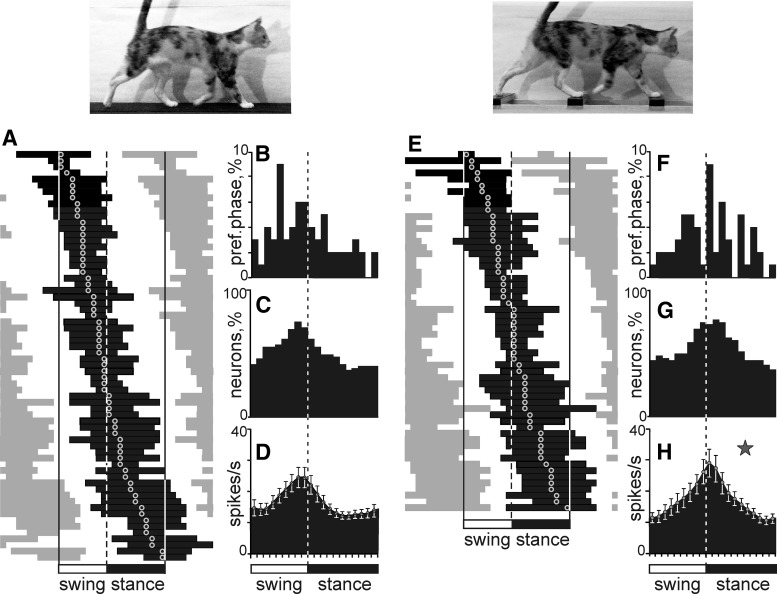
Figure 6.
Population characteristics of one-PEF neurons. A, E, Phase distribution of PEFs during walking on the flat surface (A) and along the ladder (E). Each row represents the PEF of one cell. A circular mark on a PEF denotes the preferred phase. Neurons are rank ordered so that those with a PEF earlier in the cycle are plotted on the top of the graph. The top row shows PEF and preferred phase of the neuron, the activity of which is shown in detail in Figure 4. Vertical interrupted lines indicate the end of stance and the beginning of the swing phase. B, F, Distribution of preferred phases. C, G, Proportion of active neurons (neurons in their PEF) in different phases of the step cycle. D, H, Mean discharge rate at different phases of the step cycle. Error bars show SEM. Star in H indicates the phase during which the activity of neurons during ladder walking is higher than during flat surface walking (p < 0.05, t test).

