
Figure 1.
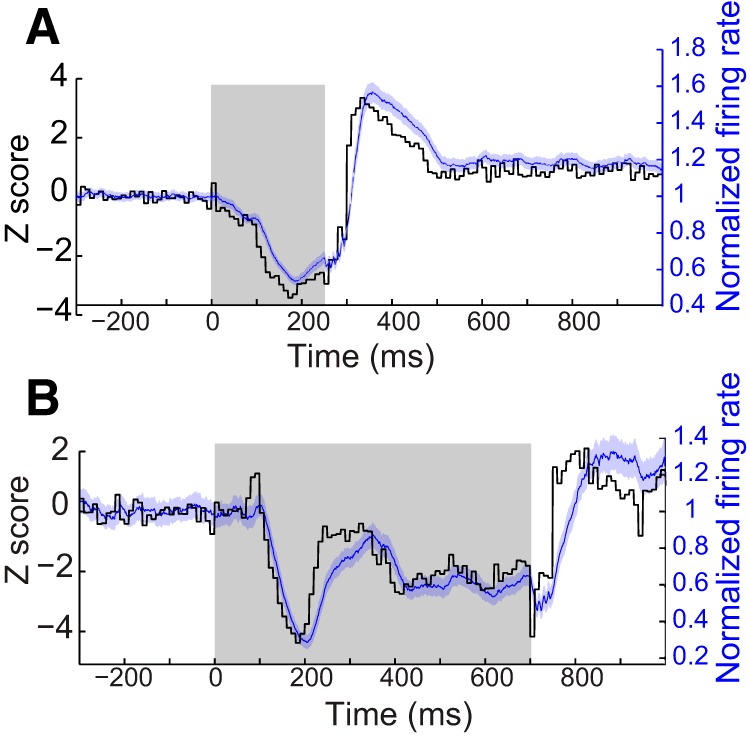
Example recordings from two PCs illustrating the relationship between peristimulus histograms and the firing rate approximation used in the present analyses. A, B, Two different PCs under different behavioral conditions. For each, the black trace represents a Z-score normalized peristimulus histogram with 10 ms time bins, whereas the blue trace represents an approximation of instantaneous firing rate, calculated using a half Gaussian kernel with 1 ms sampling. For this and all subsequent figures, the shaded region for the firing rate measure represents 95% confidence intervals. There are only small differences between the two measures, mostly when the neural response changes very rapidly.