
Figure 11.
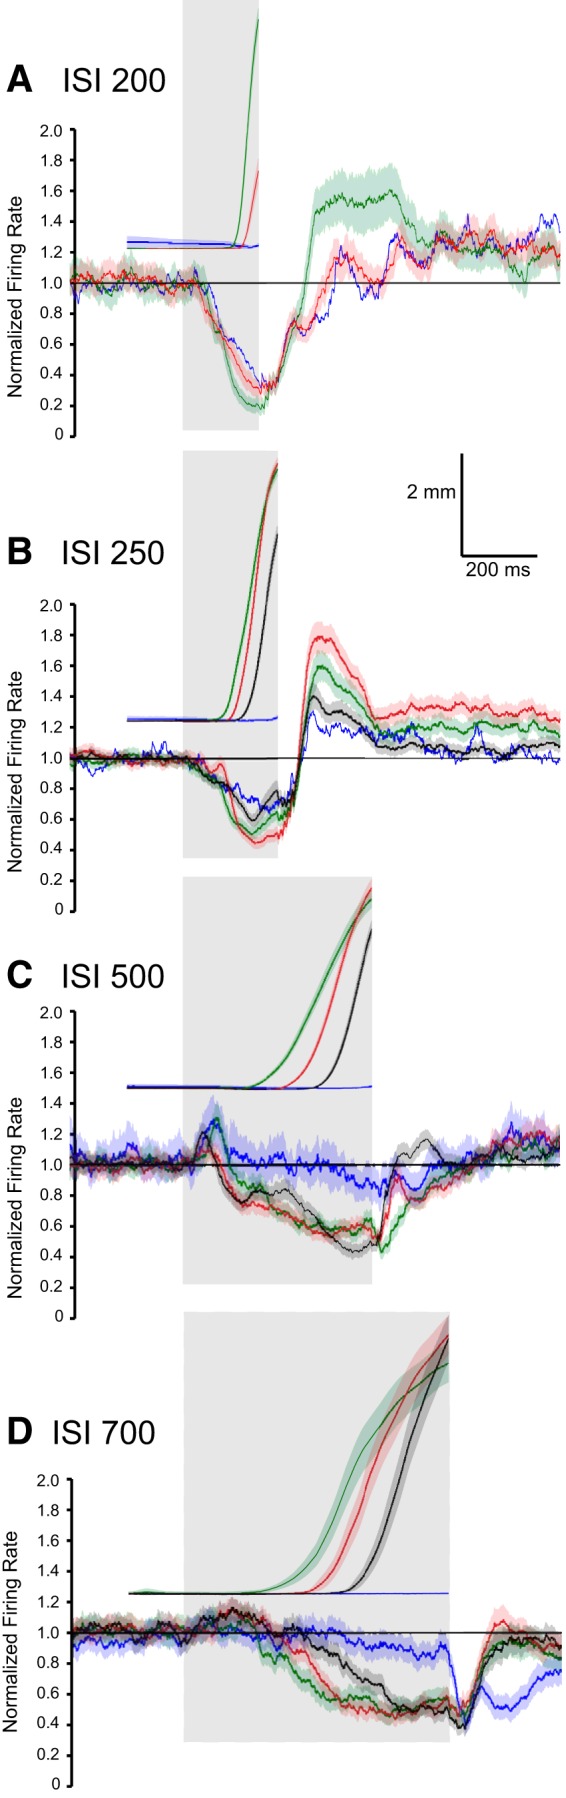
Average activity of eyelid PCs and corresponding average eyelid responses (position) where trials are grouped by latency to onset of the CRs. A, Average activity of 48 eyelid PCs and the corresponding eyelid CRs for those trials during training with an ISI of 200 ms. For both eyelid position and PC activity the green traces represent CRs with latencies to onset below the mean, the red traces represent CRs with latencies to onset above the mean, and the blue traces represent trials where there was not a CR. There are small but reliable differences in the average PC activity for the shorter-latency versus the longer-latency CRs. B, Average activity of 53 eyelid PCs and the corresponding eyelid CRs for an ISI of 250 ms. Here, and for C and D, the green traces represent the 33% of the trials with the shortest latencies to onset, the black traces the 33% with the longest latencies to onset, the red traces are the intermediate 33%, and the blue traces are the average of the non-CRs. With the large number of trials, there are small but systematic differences in the PCs responses during differently timed CRs. For the two shorter ISIs (200 and 250 ms) decreases in eyelid PC activity were observed during non-CR trials but these decreases were not sufficient for the cerebellum to generate responses. C, Same data format as in B, here for the 24 eyelid PCs that were recorded during training with an ISI of 500 ms. D, Same format as above for the 10 eyelid PCs recorded during training with an ISI of 700 ms. For the two longer ISIs (500 and 700 ms), there is very small change from baseline at the end of each ISI in eyelid PC activity during the non-CR trials.