
Figure 13.
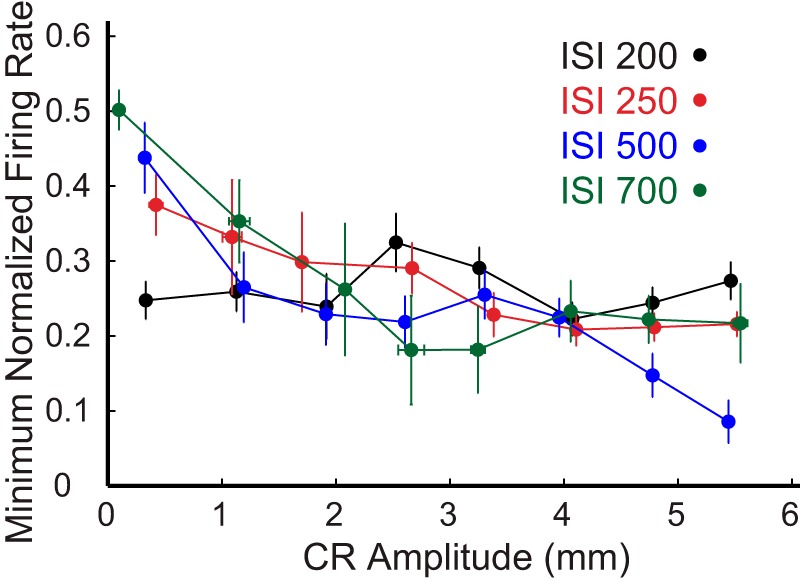
Relationship between CR amplitude and minimum averaged normalized firing rate with respect to pre-CS baseline firing rate of eyelid PCs. Different colors indicate data from eyelid PCs recorded at different ISIs. Each data point is mean within a bin (see Results). All non-CRs are located in the first bin followed by a progressive increase in CR amplitude in each successive bin. Error bars indicate SEM.