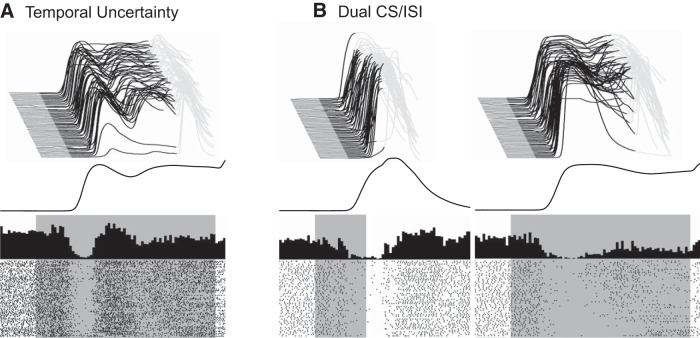
Figure 15.
Examples of behavioral responses (waterfall plots) and eyelid PC responses (raster plots and peristimulus histograms) during the two behavioral paradigms that used two ISIs. A, Temporal uncertainty training used pseudorandom sequences of trials that involved a tone CS paired with the US at either 200 or 700 ms. The waterfall plot at top shows example behavioral data from an animal trained with temporal uncertainty. Note that most trials involved a dual-peaked eyelid CR where the two peaks approximately correspond to the two times at which the US is presented. The responses shown are either paired trials with US presented at 700 ms or are CS-alone trials. The paired trials with the US presented at 200 ms are not shown. The averaged CR for the ISI 700 trials is shown below the waterfall plot. The raster plot and peristimulus histogram shows the activity of an eyelid PC from the ISI 700 trials recorded during this session. B, Dual CS/ISI training involved two different tone CSs (1 kHz and 9.5 kHz) that were paired with the US at a short ISI (200 or 250 ms) or a long ISI (700 ms). Data for the CS that used the short ISI are shown at left; the data for the CS that used a long ISI are shown at right. As in A, The waterfall plots at the top show individual eyelid responses, the average CR is shown in the middle, and at bottom are the raster plots and peristimulus histograms for an eyelid PC recorded during this session.

