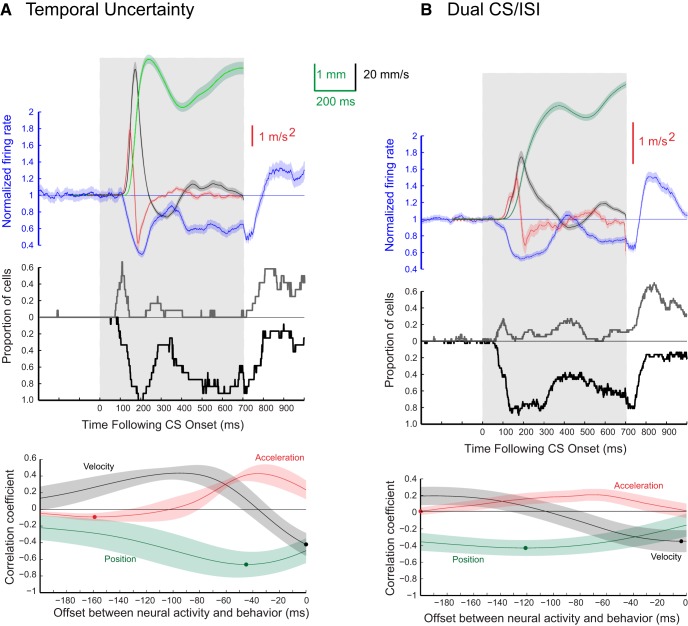
Figure 16.
Average CR and PC data for the sessions that used temporal uncertainty (A; n = 12, two rabbits) training or dual CS/ISI (B; n = 37, one rabbit) training. Formatting for this figure parallels that for Figures 4–7. The gray rectangle depicts the time at which the tone CS was present. Green traces represent average eyelid position, black traces are average eyelid velocity, red traces are average eyelid acceleration, and the blue traces are averaged normalized eyelid PC activity. Middle, The proportion of eyelid PCs that showed a significant Z-score (p < 0.01) deviation from baseline at each time bin. Gray traces indicate the proportion of PCs with a significant increase in activity and black traces indicate the proportion of cells with a significant decrease in activity. Bottom, Results from cross-correlation analysis comparing eyelid PC responding with either eyelid position (green), eyelid velocity (black), or eyelid acceleration (red). The circle on each trace shows time of the maximum negative correlation.

