
Figure 3.
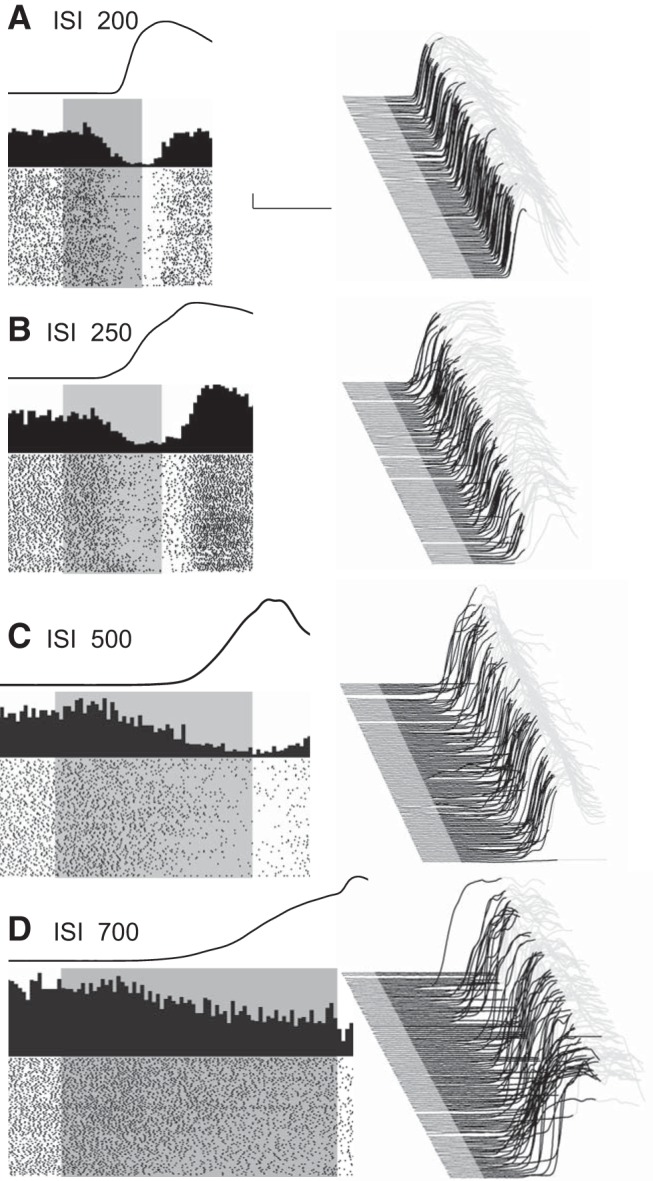
Representative examples of eyelid PC recordings during the four behavioral conditions that involved single ISIs of 200, 250, 500, and 700 ms (A–D as indicated). For each panel, a waterfall plot of all behavioral responses in the session is shown at right. For these plots, each sweep represents the response from an individual trial, first trial in front. Upward deflection represents closure of the eyelids. For each sweep the pre-CS portion is shown in dark gray, the time during which the CS was present is shown in black, with the post-US portion of each response shown in light gray. With this arrangement, all eyelid responses during the black portions of the trace are CRs. The average response during the paired CS-US trials over the entire session is shown as a single sweep above the raster plots. For the raster plots, where the first trial is on the bottom row, each dot represents the simple-spike recording from that PC. The trials are aligned such that the CS duration is shown by the gray rectangle. These data are from four different PCs and their responses are representative of those observed for the four different ISIs. Scale bar: (in A) A–D, 1 mm, 200 ms.