
Figure 7.
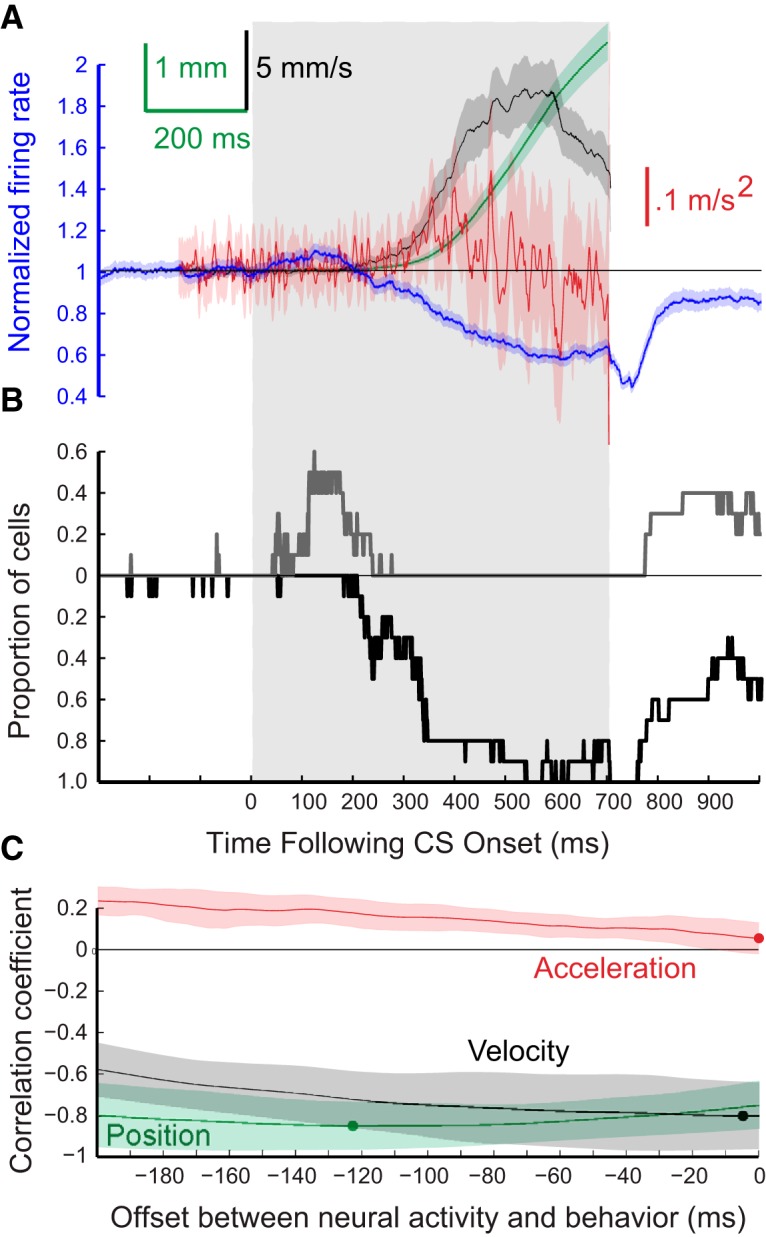
Grouped results for eyelid CRs and for the responses of the 10 eyelid PCs from one rabbit recorded during expression of conditioned eyelid responses where the ISI was 700 ms. The formatting of this figure is the same as Figure 4. A, Average PC activity (blue trace) and three measures of the eyelid CRs that were recorded at the same time. Blue trace, average PC activity; green trace, eyelid position; black trace, eyelid velocity; red trace, eyelid acceleration. B, Proportion of PCs for this group showing significant decreases in activity (black trace) or decreases in activity (gray trace) for each 1 ms time bin. C, Results of three cross-correlation analyses comparing average PC activity and either average eyelid position (green), eyelid velocity (black), or eyelid acceleration (red).