
Figure 8.
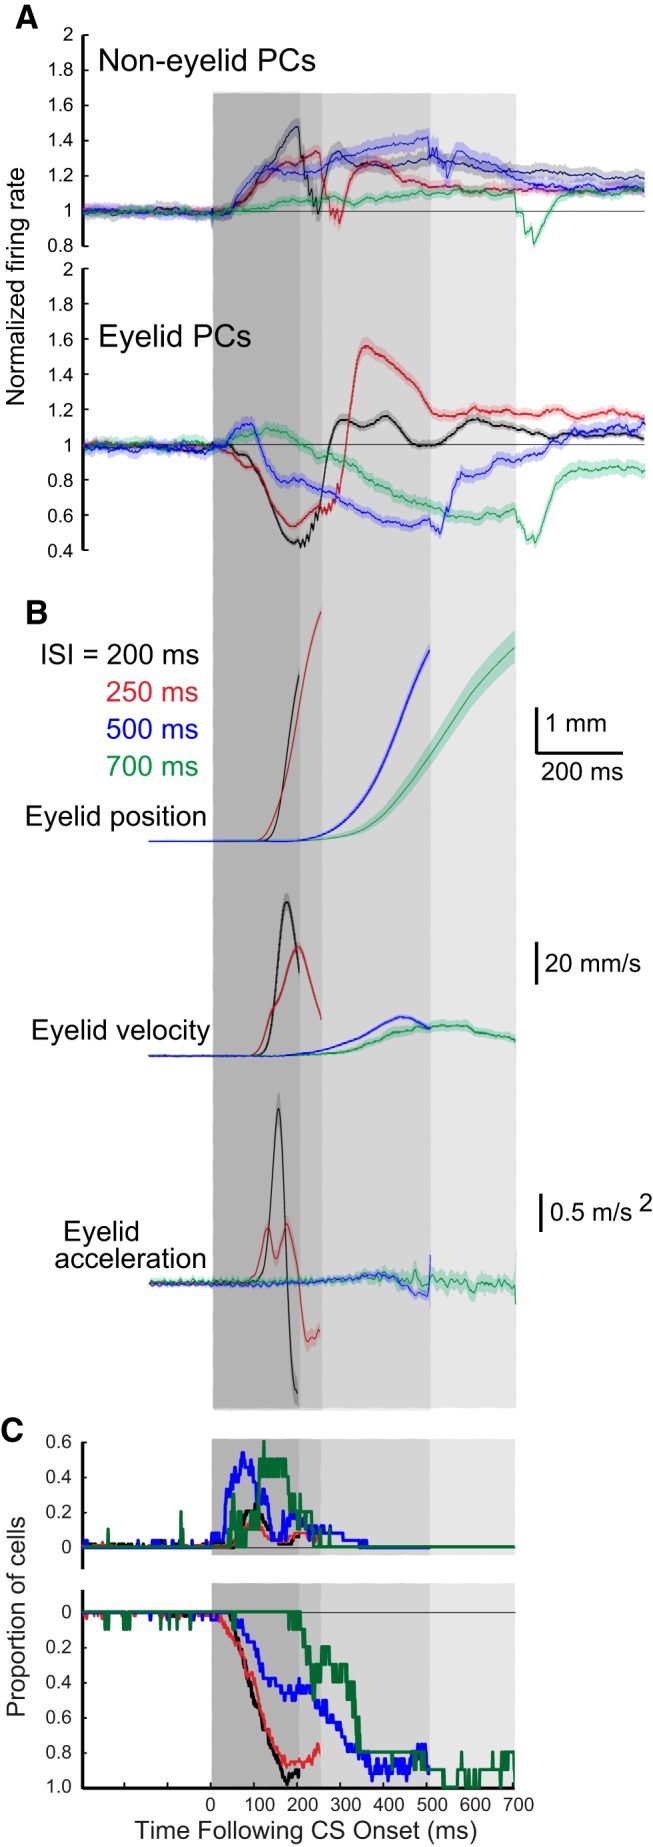
Averaged PC activity and different kinematic measures of conditioned eyelid responses for training using four different ISIs (black = 200 ms, red = 250 ms, blue = 500 ms, green = 700 ms). The differently shaded gray regions show the CS duration for the four ISIs. The darkest region shows the 200 ms ISI, this region plus the next darkest region show the 250 ms ISI, this region and the next darkest shows the 500 ms ISI, etc. A, Average PC activity for non-eyelid (top) PCs and eyelid (bottom) PCs for the four different ISIs. B, Three different kinematic measures of the average conditioned eyelid responses expressed during the PC activity shown in A. For the eyelid PCs shown in A and all of the sweeps shown in B, these are the same sweeps shown in Figures 4A, 5A, 6A, and 7A combined. C, Average proportion of PCs showing significant decreases or increases in activity for the four different ISIs. For each ISI the traces are truncated at the time of each corresponding US onset for better visibility. Together, these panels show the differences in the CRs that are acquired with training at the four different ISIs and how PC activity differs during the expression of these responses.