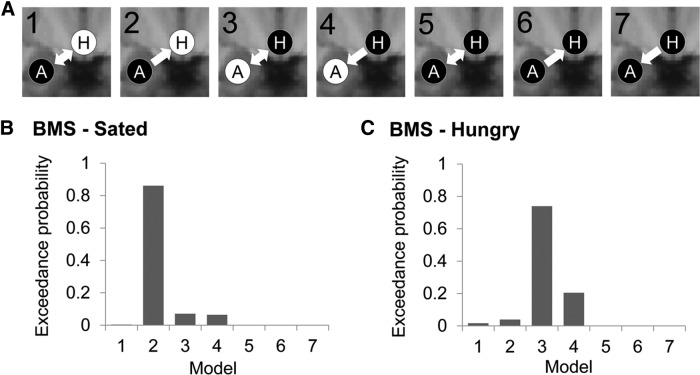
Figure 7.
Dynamic causal modeling. A, Schematic of the seven dynamic causal models tested. A, BLA; H, hypothalamus. White text on black circles indicates input of Milkshake and Tasteless into that node. Arrows indicate directionality of intrinsic connections between nodes. B, Results of Bayesian model selection at Sated scan selecting Model 2 as the “winning” model. C, Results of Bayesian model selection at Hungry scan selects Model 3 as the “winning” model.

