Figure 4.

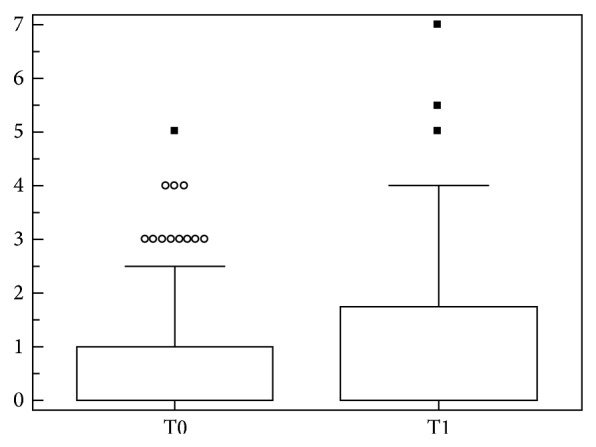
Mean ECLAM values before (T0) and after (T1) modification of anti-dsDNA status. Box and whiskers plot (median, quartiles, range, and possible extreme values).

Mean ECLAM values before (T0) and after (T1) modification of anti-dsDNA status. Box and whiskers plot (median, quartiles, range, and possible extreme values).