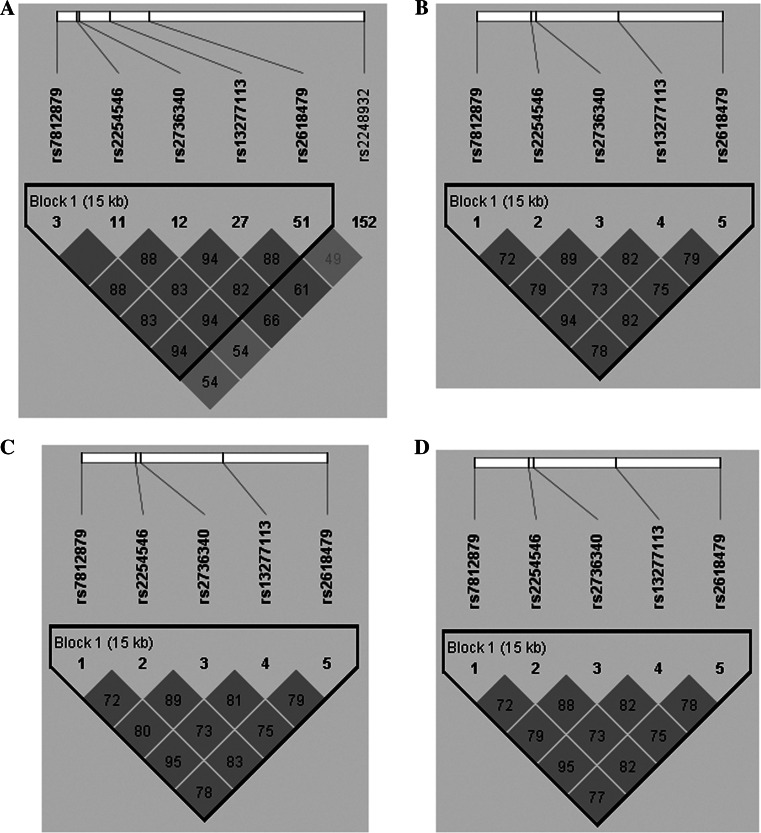
Fig. 1.
Linkage disequilibrium (LD) analysis of the SNPs in the FAM167A-BLK gene region. The LD plots were generated by Haploview software v4.2, and data from our study were similar to that from the HapMap CHB population. The number (divided by 100) in the small square represents r 2 value and ranges from 0 to 1. The five SNPs (rs2736340, rs7812879, rs13277113, rs2618479 and rs2254546) in FAM167A-BLK reside in an LD block. a The data from HapMap CHB. b The data analysis between PM patients and healthy controls from our study. c The data analysis between DM patients and healthy controls from our study. d The data analysis between PM/DM patients and healthy controls from our study

