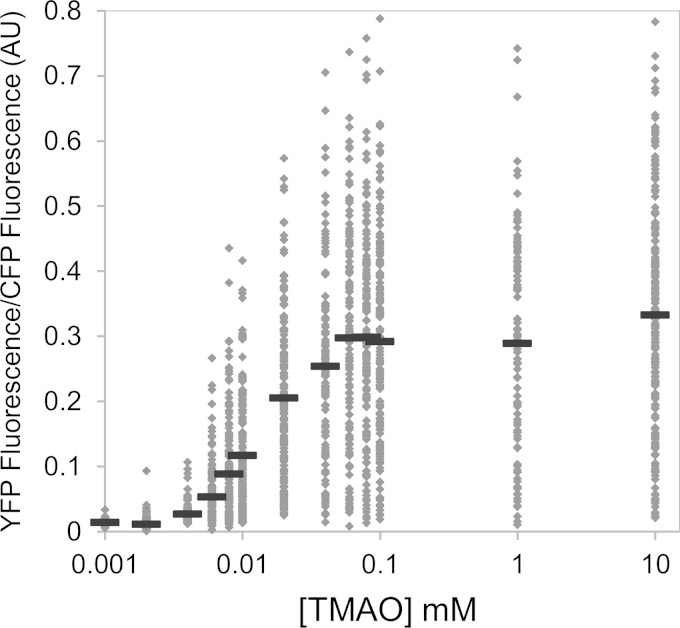
FIG 2.
Scatter plot of the TMAO dose responses of single cells. Cultures of strain MMR8 [PtorCAD-yfp Φ(ompA+-cfp+)] were grown aerobically in minimal medium in the presence of the TMAO concentrations indicated and analyzed by fluorescence microscopy as described in Materials and Methods. Each dot represents the fluorescence value of an individual cell. For each dose, measurements of at least 100 cells were made. Each solid horizontal line represents the mean value for each dose. AU, arbitrary units.

