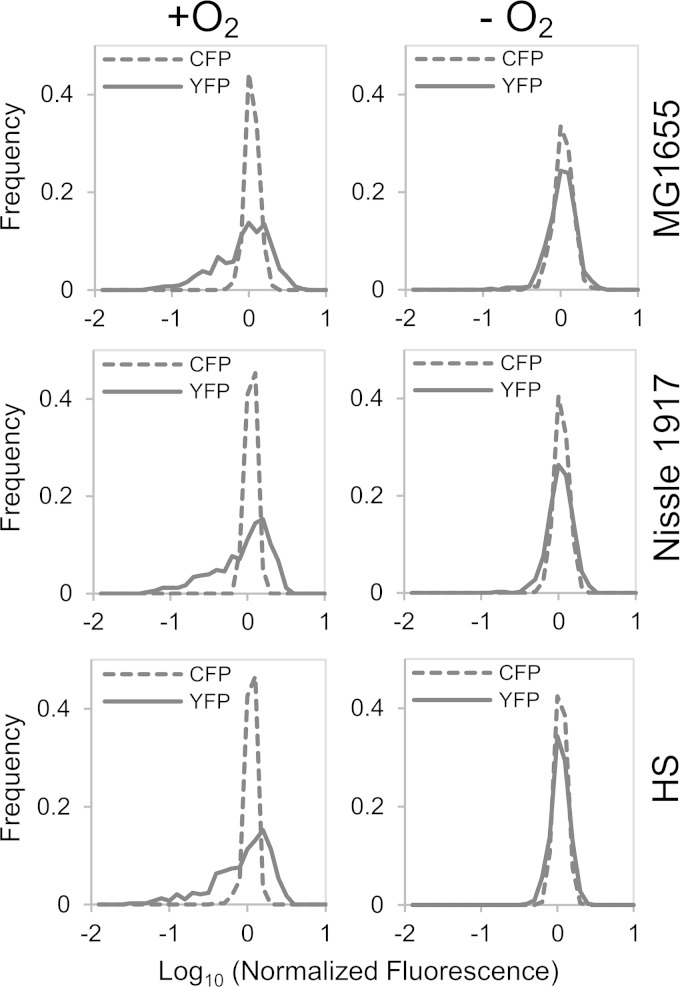
FIG 3.
Fluorescence distributions of the PtorCAD-yfp reporter expression for three different E. coli strains in the presence or absence of oxygen. Cultures of strains MMR234 [Nissle 1917 PtorCAD-yfp Φ(ompA+-cfp+) ΔsulA::(FRT-kan-FRT)], MMR235 [HS PtorCAD-yfp Φ(ompA+-cfp+) ΔsulA::(FRT-kan-FRT)], and MMR233 [MG1655 PtorCAD-yfp Φ(ompA+-cfp+) ΔsulA::(FRT-kan-FRT)] were grown in minimal medium with or without 10 mM TMAO and with or without aeration, as indicated, and analyzed by fluorescence microscopy as described in Materials and Methods. The plots show the distribution of single-cell YFP and CFP fluorescence in TMAO-treated cultures of each strain (top, middle, and bottom panels) with oxygenation (left column) or without oxygenation (right column). Data sets consisted of more than 350 single-cell measurements that were combined from two independent experiments. Values on the x axis are expressed as log10 fluorescence normalized by the mean value of the data set.

