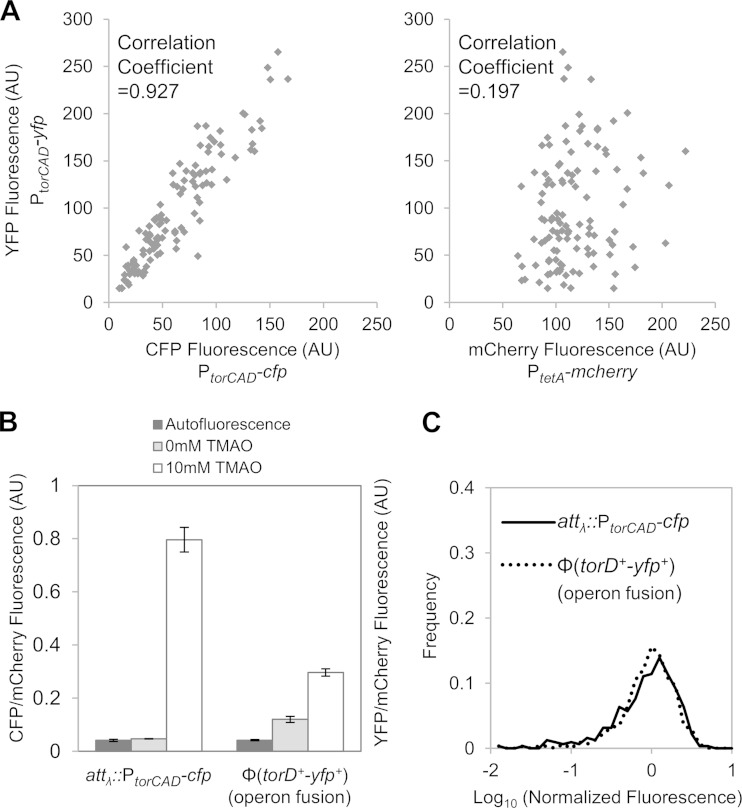
FIG 4.
Comparison of two torCAD reporters in the same cell. (A) Correlation between two promoter fusion reporters (PtorCAD-cfp and PtorCAD-yfp) at different chromosomal loci. Cultures of strain MMR72 (PtorCAD-cfp, PtorCAD-yfp, and PtetA-mcherry) were grown aerobically in minimal medium containing 10 mM TMAO and analyzed by fluorescence microscopy as described in Materials and Methods. Fluorescence values of YFP versus CFP (left panel) and YFP versus mCherry (right panel) are plotted for 113 cells; YFP values are the same in both plots. (B and C) Comparison of promoter and operon fusions in the same cells. Cultures of strain MMR141 [PtorCAD-cfp, Φ(torD+-yfp+), and PtetA-mcherry] were grown aerobically in medium with or without 10 mM TMAO, as indicated. The autofluorescence of cultures of the parent strain, MMR60, grown under the same conditions was determined in the YFP and CFP fluorescence channels. (B) Average fluorescence from the promoter and operon fusions, PtorCAD-cfp and Φ(torD+-yfp+), each normalized by the fluorescence of PtetA-mcherry. Shown are the mean values of two independent experiments, and error bars represent the range. In each experiment, the mean values of >100 cells were determined. (C) Distribution of fluorescence from single cells induced with 10 mM TMAO. For Φ(torD+-yfp+), the mean YFP fluorescence of noninduced cells was subtracted from the fluorescence of induced cells. Values on the x axis are expressed as log10 fluorescence normalized by the mean value of the corresponding data set. The distribution is based on measurements of >300 cells. AU, arbitrary units.

