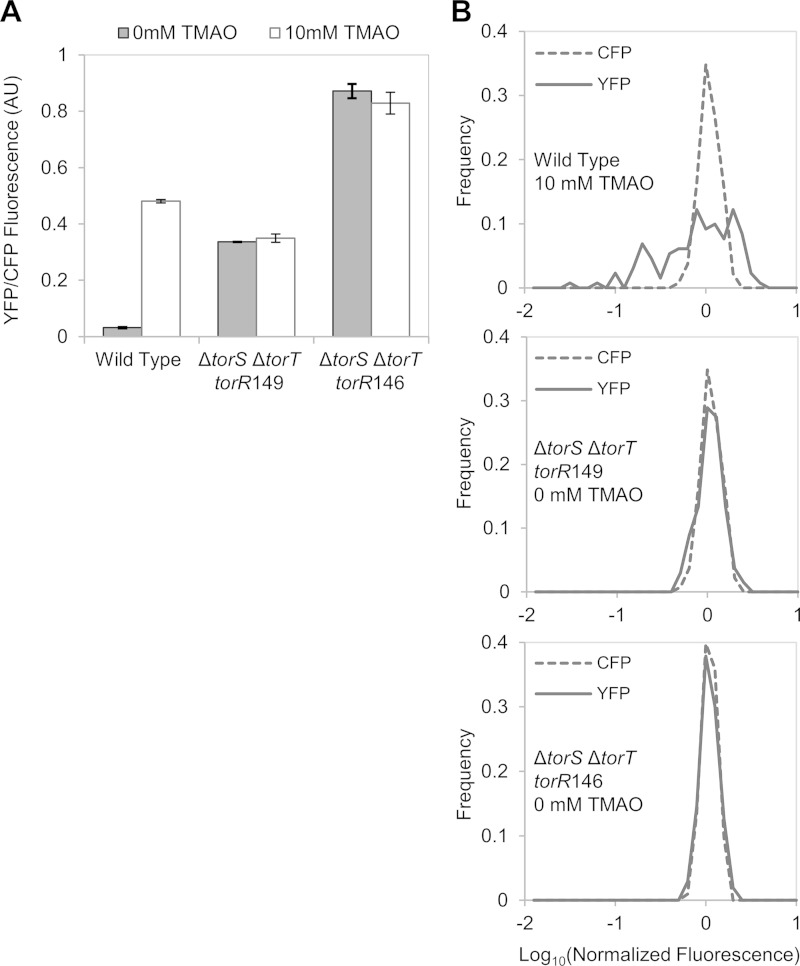
FIG 6.
Comparison of PtorCAD-yfp expression in a strain expressing wild-type TorR and strains expressing constitutively active TorR mutants that bypass TorS. Cultures of MMR125 [PtorCAD-yfp Φ(ompA+-cfp+)], MMR138 [ΔtorS ΔtorT torR146 PtorCAD-yfp Φ(ompA+-cfp+)], and MMR140 [ΔtorS ΔtorT torR149 PtorCAD-yfp Φ(ompA+-cfp+)] were grown aerobically in minimal medium with or without 10 mM TMAO and analyzed by fluorescence microscopy as described in Materials and Methods. (A) Average fluorescence from single cells. Shown are the mean values of two independent experiments, and error bars represent the range. Sets of over 100 single cells were analyzed for each experiment. AU, arbitrary units. (B) Distributions of single-cell fluorescence in samples from wild-type (top panel, 131 cells), torR149 (middle panel, 135 cells), and torR146 (bottom panel, 103 cells.) Values on the x axis are expressed as log10 of fluorescence normalized by the mean value of the corresponding data set.

