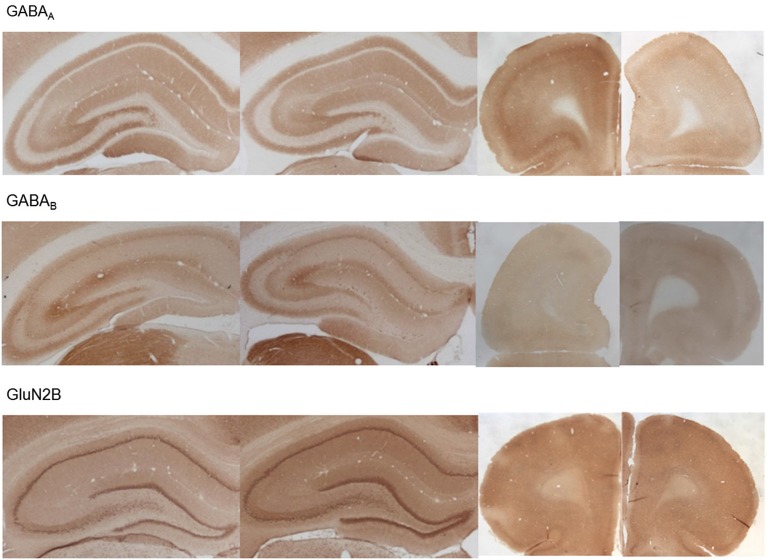
Figure 7.
Photomicrographs of expression of GABA(A), GABA(B) and GluN2B in the hippocampus and prefrontal cortex. Photomicrographs show examples of receptor expression in the hippocampus (left panels) and prefrontal cortex (PFC) (right panels) 4 weeks after MK801-treatment. In each case, the left panel for the respective subregion shows the control examples. Examples for GABA(A), GABA(B), and GluN2B are shown. Scale bar, hippocampus 1 mm, PFC 5 mm. The examples highlight the decrease of GABA(A)-receptor expression in the prefrontal cortex, the increase of GABA(B)-receptor expression in the dentate gyrus and prefrontal cortex and the increase of GluN2B expression in the dentate gyrus 4 weeks after MK801-treatment.

