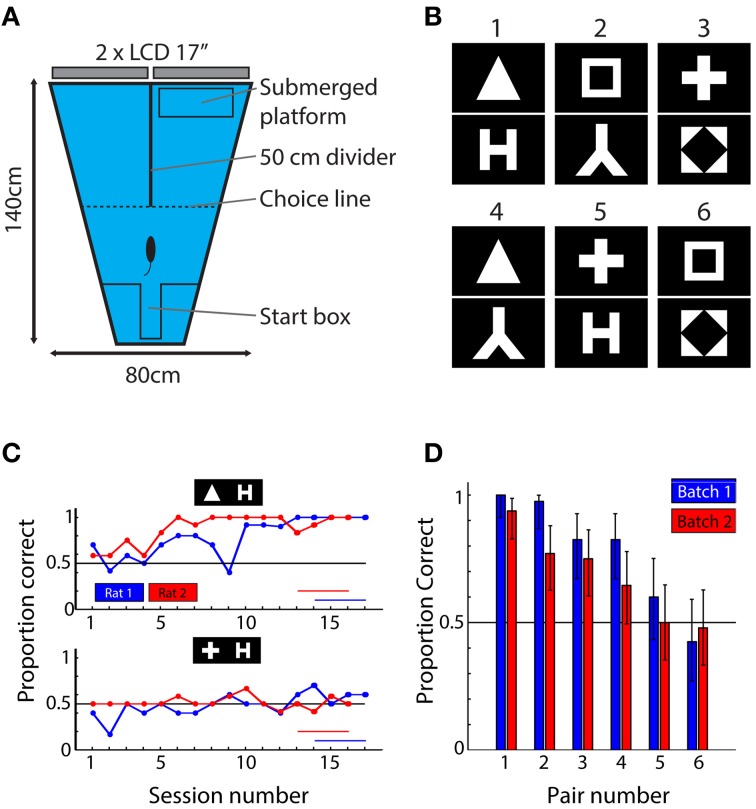
Figure 1.
Behavioral setup, stimuli, and results. (A) Top-view of the behavioral setup. Animals were released at the short end of the water maze and had to find the submerged platform in one of the two arms. The identity of the shapes presented on the screens at the end of each arm predicted the platform location. (B) The six shape pairs used in the behavioral experiment. (C) Learning curves for one pair (triangle vs. letter H) that was readily learned and one pair (plus vs. letter H) that was not learned in the allocated time. Red and blue horizontal lines indicate sessions that were used to calculate mean performance. (D) Mean performance over the last four sessions of the experiment ordered according to average performance per pair (i.e., over two animals). Blue bars indicate performances of rats from batch 1; red bars show data for rats from batch 2. The results show that the six pairs used in this study yield a wide range of performances. Error bars indicate binomial confidence intervals at the 0.05 level.

