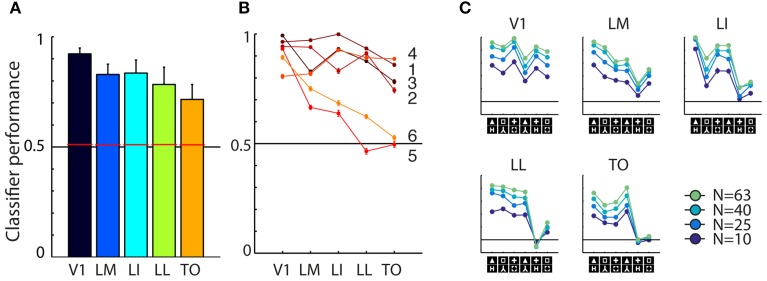
Figure 3.
Overview of neural data. (A) Average SVM classification performance for the six shape pairs used in this study, for each of the five areas. Red bars indicate significance threshold based on shuffled condition labels. Error bars indicated SEM over six pairs. (B) Classifier performance for individual pairs, pair numbers correspond to those used in Figure 1B. Performance for pairs five and six falls to chance toward higher areas. (C) Results for the control analysis in which we reduced the number of units included in individual sub-samplings of the SVM classifier. Average performance decreases with lower number of cells included, but the overall pattern of classification is preserved. The order of shape pairs corresponds to that in Figures 1B,D.

