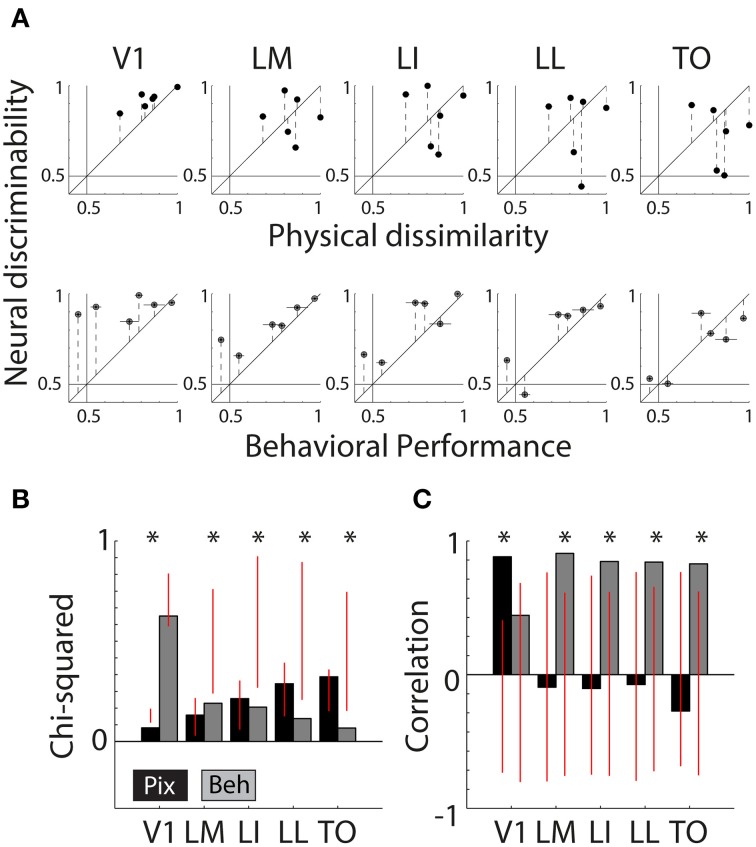
Figure 4.
Correlations between neural responses, pixel similarity, and behavioral performance. (A) Scatterplots of neural discriminability data for six shape pairs in five cortical areas compared to physical dissimilarity (average between PIX and V1Sim measures; top row) and behavioral performance (average for two rats; bottom row). Correspondence with physical dissimilarity is high for V1 and decreases toward higher areas; i.e., points fall further from the diagonal identity line. In contrast, behavioral performance is increasingly well matched to neural discriminability toward higher areas, with points falling closer to the diagonal. Error bars indicate SEM over both physical dissimilarity measures in top row, SEM over both animals in bottom row and SEM for neural data in both. (B) Chi-square values are reported for each scatter plot shown in (A). Black bars show chi-square values between physical dissimilarity and neural data. Gray bars show chi-square values for neural data and behavior. Red vertical lines indicate the random distribution obtained through permutation analysis. Stars indicate significant chi-squares values at the 0.05 level. (C) Correlations as a measure of correspondence of neural discriminability with pixel-based differences (black bars) and with behavioral performance (gray bars). Red vertical lines indicate the random distribution obtained through permutation analysis. Stars indicate significant correlations at the 0.05 level.

