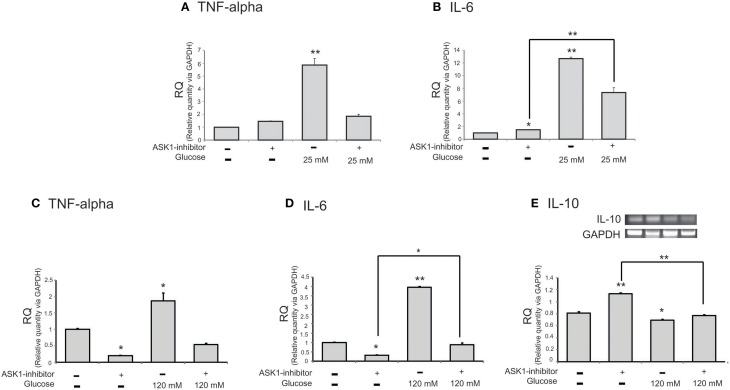
Figure 3.
The mRNA level of cytokines on microglia in high glucose stress. The mRNA levels of TNF-alpha, IL-6, IL-10 were measured using quantitative real time–PCR (A–D) and reverse transcription-PCR (E). (A) The mRNA level of TNF-alpha was increased in the high glucose treatment group (25 mM) and reduced in ASK1 inhibitor pre-treated high glucose group. (B) The mRNA amount of IL-6 was increased in the high glucose treatment group (25 mM) and significantly decreased in ASK1 inhibitor pre-treated high glucose group. (C) The mRNA level of TNF-alpha was increased in the high glucose treatment group (120 mM) and reduced in ASK1 inhibitor pre-treated high glucose group. (D) The mRNA amount of IL-6 was increased in the high glucose treatment group (120 mM) and significantly decreased in ASK1 inhibitor pre-treated high glucose group (120 mM). (E) The mRNA level of IL-10 exhibited decrease of expression in the high glucose treatment group (120 mM) whereas it significantly increased in ASK1 inhibitor pre-treated high glucose group (120 mM). GAPDH was used as a control. Each experiment included the 3 repeats per condition. Data were expressed as mean ± S.E.M, and were analyzed statistically using One-Way ANOVA, followed by Bonferroni's post hoc. *p < 0.05, **p < 0.001. RQ, relative quantitative value of mRNA via GAPDH.

