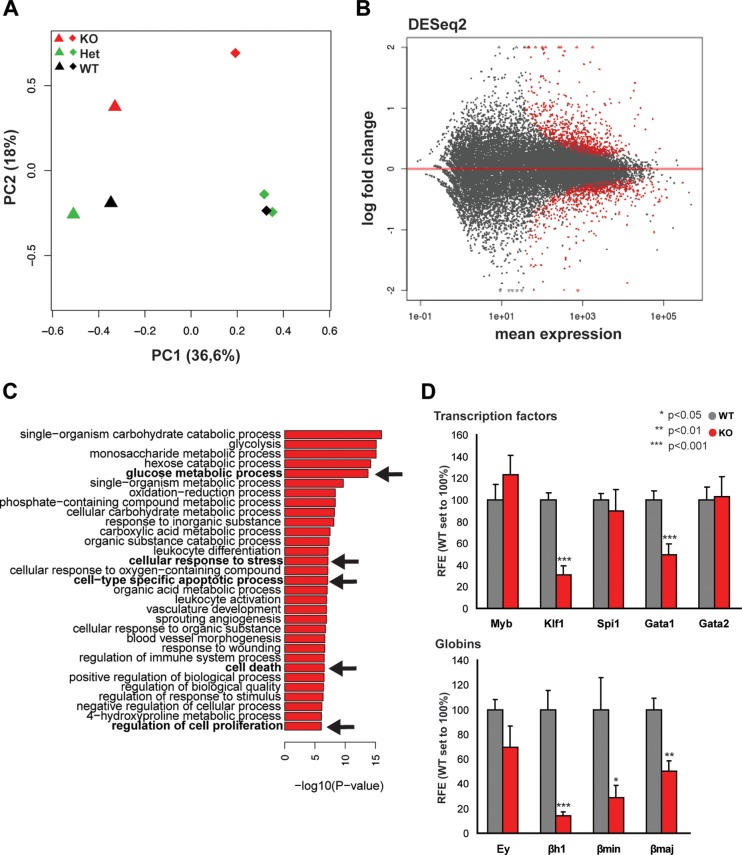
FIG 4.
Analysis of gene expression in TAF10KOcEry fetal livers at E12.5. (A) PCA plot of the first two components of the fetal liver samples (from TAF10KOcEry mice [KO], heterozygous TAF10KO mice [Het], and WT mice) analyzed by RNA-seq. The variance explained by each component is depicted in parentheses on the axes. (B) MA plot of the mean normalized gene count versus the log2 fold changes in gene expression in TAF10KOcEry mice compared with that in WT and heterozygous TAF10KO mice. Genes are plotted as black circles. Genes with an adjusted P value (FDR) of <0.01 are colored red. Genes that fall out of the window boundaries of −2 or 2 log2 fold change are plotted as open triangles. (C) GO analysis of the upregulated genes in the TAF10KOcEry fetal livers. Metabolic pathways, cell-type-specific apoptotic and cell death-related processes, and proliferation were among the most affected and are indicated in boldface and with arrows. (D) qRT-PCR of total mRNA of fetal liver cells at E12.5. The expression levels of transcription factors and globin genes are depicted. Bars represent standard errors of the means (SEMs). RFE, relative fold enrichment.

