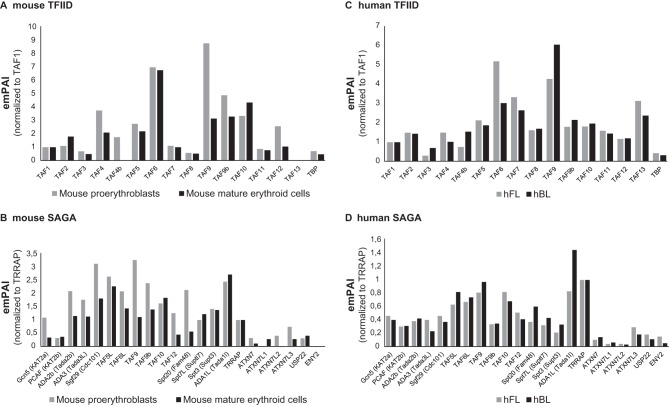
FIG 6.
Mass spectrometry of TFIID and SAGA complexes in mouse and human erythroid cells. (A and B) TAF10-containing TFIID (A) and SAGA (B) complexes were isolated by TAF10 immunoprecipitation from protein extracts prepared from immature and differentiating (mature) mouse erythroid cells and analyzed by mass spectrometry. The relative abundance (emPAI) values of the different subunits in the isolated complexes were first normalized by comparing the abundance values of all the subunits of TFIID to those for TAF1 or the abundance values of all the subunits of SAGA to those of TRRAP. TAF1 and TRRAP are the largest subunits in each complex. (C and D) Similarly, TAF10-containing TFIID (C) and SAGA (D) complexes were isolated by TAF10 immunoprecipitation from protein extracts prepared from hFL and hPB cells and analyzed by mass spectrometry. The emPAI values presented were normalized as described for the mouse samples.

