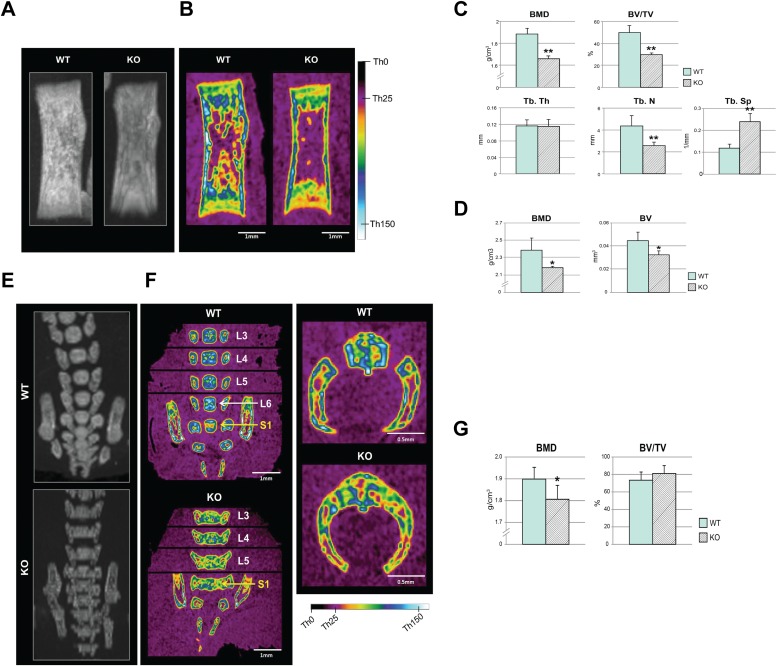
FIG 6.
High-resolution microCT analysis of femurs and lumbar vertebrae. (A and B) Overview radiographic maximum intensity projection (MIP) (A) and color-coded midcoronal sectional images (B) of femurs generated from a microCT data set, with a color scale marked with reference threshold values. (C) Quantification of BMD, BV/TV, and trabecular structures (Tb.Th, Tb.N, and Tb.Sp) in the trabecular bone. (D) Quantification of BMD and BV in the cortical bone. (E and F) MIP (E) and color-coded midcoronal sectional images (F) of vertebral bodies at L3 to S1 (the first sacral vertebra) levels showing abnormal ossification patterns in KO mice (the exact midcoronal image of each vertebral body was captured separately and then stitched together, as marked by black lines in panel F). (F) (Left) Overall mineral density was visibly reduced in KO mice, as shown by colors corresponding to lower threshold values. (Right) Bilaterally fused vertebral body and dorsal arches. (G) Quantification of the lumbar vertebrae at levels L3 to L5 presented significantly reduced BMD but slightly increased BV/TV in KO mice. n = 4 in each group. *, P < 0.05, and **, P < 0.01 compared to the WT. The error bars indicate means and SD.

