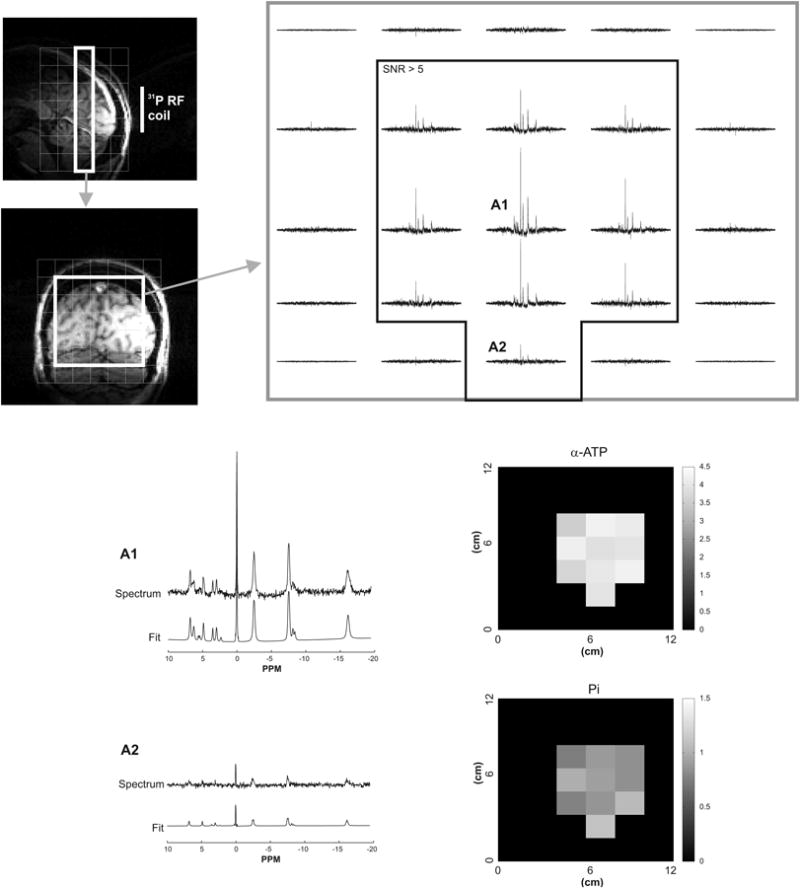
Figure 5.

Example of LCModel analysis of 31P MRSI data acquired in one human subject at 7 T. The 5×5 spectral grid shows spectra from the central part of a coronal slice (white box on T1-weighted sagittal and coronal images). LCModel fits are shown for two different voxel locations (denoted as A1 and A2). Voxels where the SNR of PCr was greater than 5 (shown by the black box on the 5×5 spectral grid) were used to generate the concentration maps (in μmol/g) for α-ATP and Pi as determined by LCModel.
