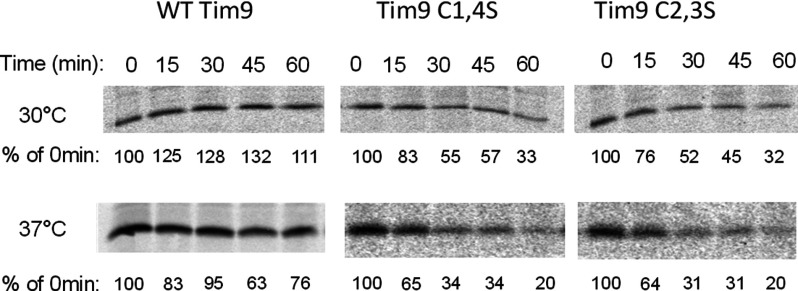
Figure 3. Pulse-chase analysis of Tim9 levels in WT and tim9 cells.
Cells were grown at 30°C to early log phase, then pulse-labelled with 35S-methionine for 5 min. Following the addition of 20 mM cold methionine and 10 μg/ml cycloheximide, samples were incubated at 30°C or 37°C and then frozen in 10% TCA at the specified time points. Tim9 antibodies were used to immunoprecipitate Tim9 and labelled Tim9 was detected by autoradiography. Levels were quantified and expressed as a percentage of intensity at 0 min.

