. 2015 Apr 24;4:e05981. doi: 10.7554/eLife.05981

Figure 1. Single-photon responses: activation of individual wild-type and mutant rhodopsins.

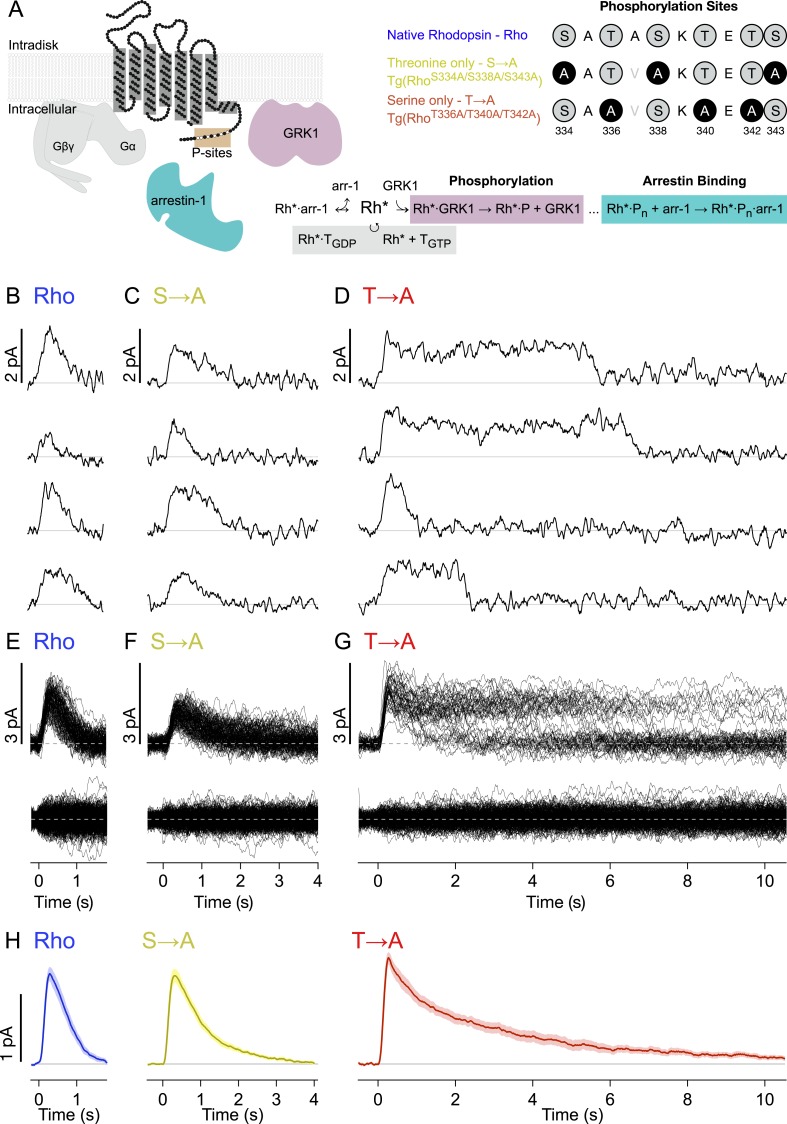
(A) Schematic showing rhodopsin, the G protein transducin (T = Gβγ and Gα, gray), G protein receptor kinases 1(GRK1), and arrestin-1. Phosphorylation consists of GRK1 binding and phosphate attachment. Arrestin-1 serves to quench rhodopsin activity and to compete with GRK1, modifying the GRK1 binding rate (Doan et al., 2009). The upper right panel shows the sequence of the rhodopsin C-terminus and the mutations to test the effects of replacing either threonine or serine residues with alanine. The mutation A337V is included to produce a linear epitope for mAb 3A6, as in Mendez et al. (2000). Labels indicate strain nomenclature (above) and protein nomenclature (below). (BD) Representative examples of individual single-photon responses (SPRs). (EG) All SPRs from representative cells of each strain, with identified singles (∼50) above and failures (no response to flash, ∼150) below: (B, E) Rhodopsin (wild type, WT); (C, F) S → A, previously referred to as STM (Mendez et al., 2000); (D, G) T → A. (H) Average SPRs across all cells: WT—N = 8, S → A—N = 9, T → A—N = 9.

DOI: http://dx.doi.org/10.7554/eLife.05981.003

Figure 1.

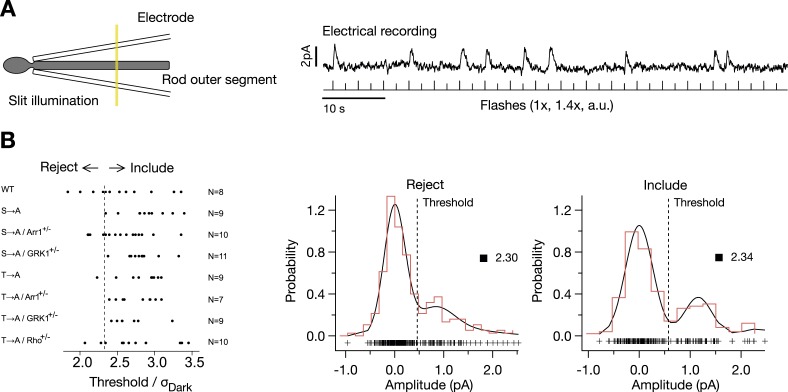
Figure 1—figure supplement 1. Isolation of single-photon responses.

Figure 1—figure supplement 1.

(A) Configuration for recording. The flash intensity was adjusted to produce occasional responses, as shown in the example trace. Determination of quantal analysis parameters: a template (the average response) was scaled to match the rising phase of the flash-aligned response. The amplitude distribution was fit with a quantal response model, where:
P(n)=exp(λ)λn/n!,
is the probability of activating n rhodopsin molecules, and:
p(a|n)=(2π(σD2+nσA2))1/2exp((anA¯)22(σd2+nσA2)),
is the probability that n active rhodopsin molecules produce a response with amplitude a, with parameters: mean Rh*/flash (λ), failure noise (σD), mean SPR amplitude (A), and SPR dispersion (σA) (Baylor et al., 1979). The full distribution is given as:
p(a)=np(a|n)P(n).
(B) Thresholds for classifying responses θ1, θ2 were calculated such that:
p(θ1|0)P(0)=p(θ1|1)P(1),
and
p(θ2|1)P(1)=p(θ2|2)P(2).
Plotted are the cell selection criteria, θ1Dark for each cell, included or rejected, for each mouse strain. On the right are example amplitude distributions for a cell that fails the criterion (θ1Dark < 2.33) (left plot) and one that passes (right plot).