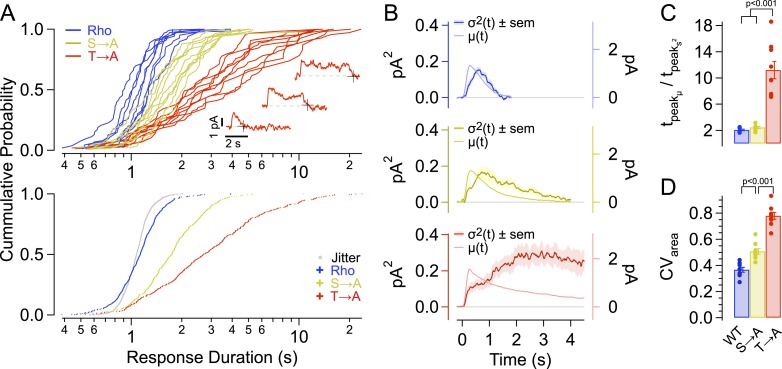
Figure 2. Single-photon response properties.
(A-top) Distribution of response durations for each cell (single line). The response duration was determined by detecting the transition from an ‘up’ state to a ‘down’ state, as in Draber and Schultze (1994) (Inset). (A-bottom) Pooled distributions across cells. Noise in determining response duration shown in gray. Response duration distributions are non-normal (p < 0.001, K-S test for non-normality) and are significantly different from one another at the 99% confidence level (Kruskal–Wallis analysis of variance, corrected for multiple comparisons). (B) Average time course of SPR variance (left axis) compared to the average SPR (right axis) for each strain. (C) Ratio of the time-to-peak of the variance relative to the time-to-peak of the mean response across cells for each strain. WT—2.1 ± 0.8 s; S → A—2.4 ± 0.8 s; T → A—11.2 ± 0.8 s. WT and S → A n.s. (D) Coefficients of variation, CVarea, for individual cells (points) and mean ± SEM (bars). All measurements are significantly different (p < 0.001, one-way ANOVA, corrected for multiple comparisons).

