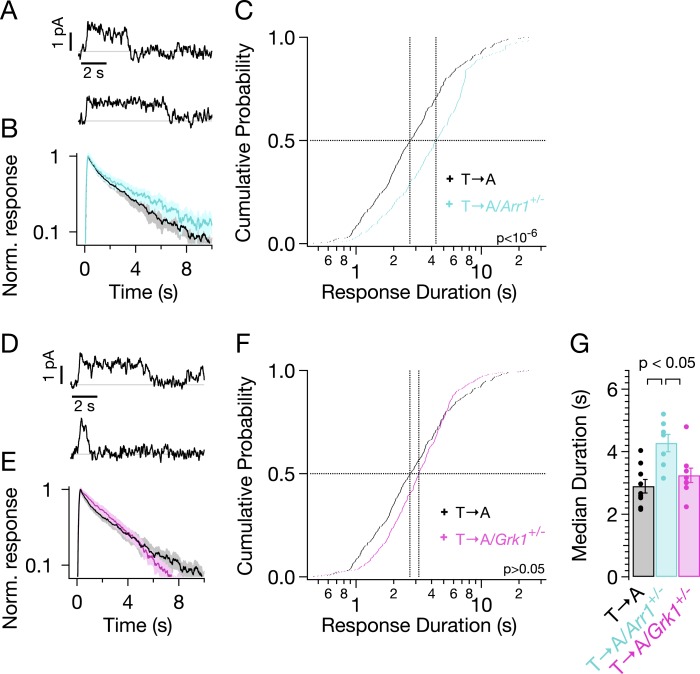
Figure 7. Genetic reduction of arrestin-1 expression prolongs T → A responses.
(A) Representative SPRs in T → A/Arr1+/− rods. (B) Average single T → A responses across cells with either normal (black) or lowered (cyan) arrestin-1 concentration, showing slower response decay with lower arrestin-1 (log y-axis). (C) Response durations in all cells with either normal (black) or lowered (cyan) arrestin-1 concentration. Pooled distributions are significantly different (p < 10−6, Kruskal–Wallis analysis of variance). (D–F) Comparison of T → A and T → A/GRK1+/− (magenta) responses. Pooled response duration distributions are indistinguishable (p > 0.05, Kruskal–Wallis analysis of variance). (G) Median response durations with reduced arrestin-1 or GRK1 in individual T → A rods.

