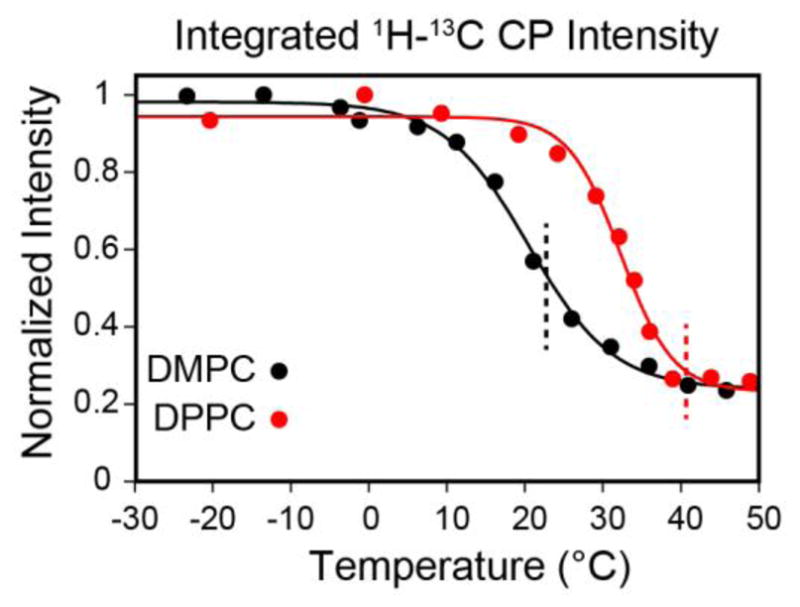
Figure 4.

The integrated signal intensities for [13Cα,15N-Leu] EmrE in DMPC (black) and [13C,15N-Val, 13Cα,15N-Leu] EmrE in DPPC (red) from the spectra in Figure 3. The integrations were carried out between 50 and 61 ppm in the 13C spectra. The solid curves represent sigmoidal fits for the two lipid compositions, where the inflection point is at 20.4 °C for DMPC and 32.3 °C for DPPC. The dashed lines mark Tm for DMPC (black, 22.7 °C) and DPPC (red, 40.7 °C).
